
Follow the work.
Count the tokens.
One CLI for the session logs of 17 AI coding agents. See tokens and estimated cost by day, project, and session, across every machine you work on, and open any report as an interactive page.
npm install -g llm-usage-metricsNode.js 22.16+ or 24+, or Bun macOS, Linux, Windows MIT
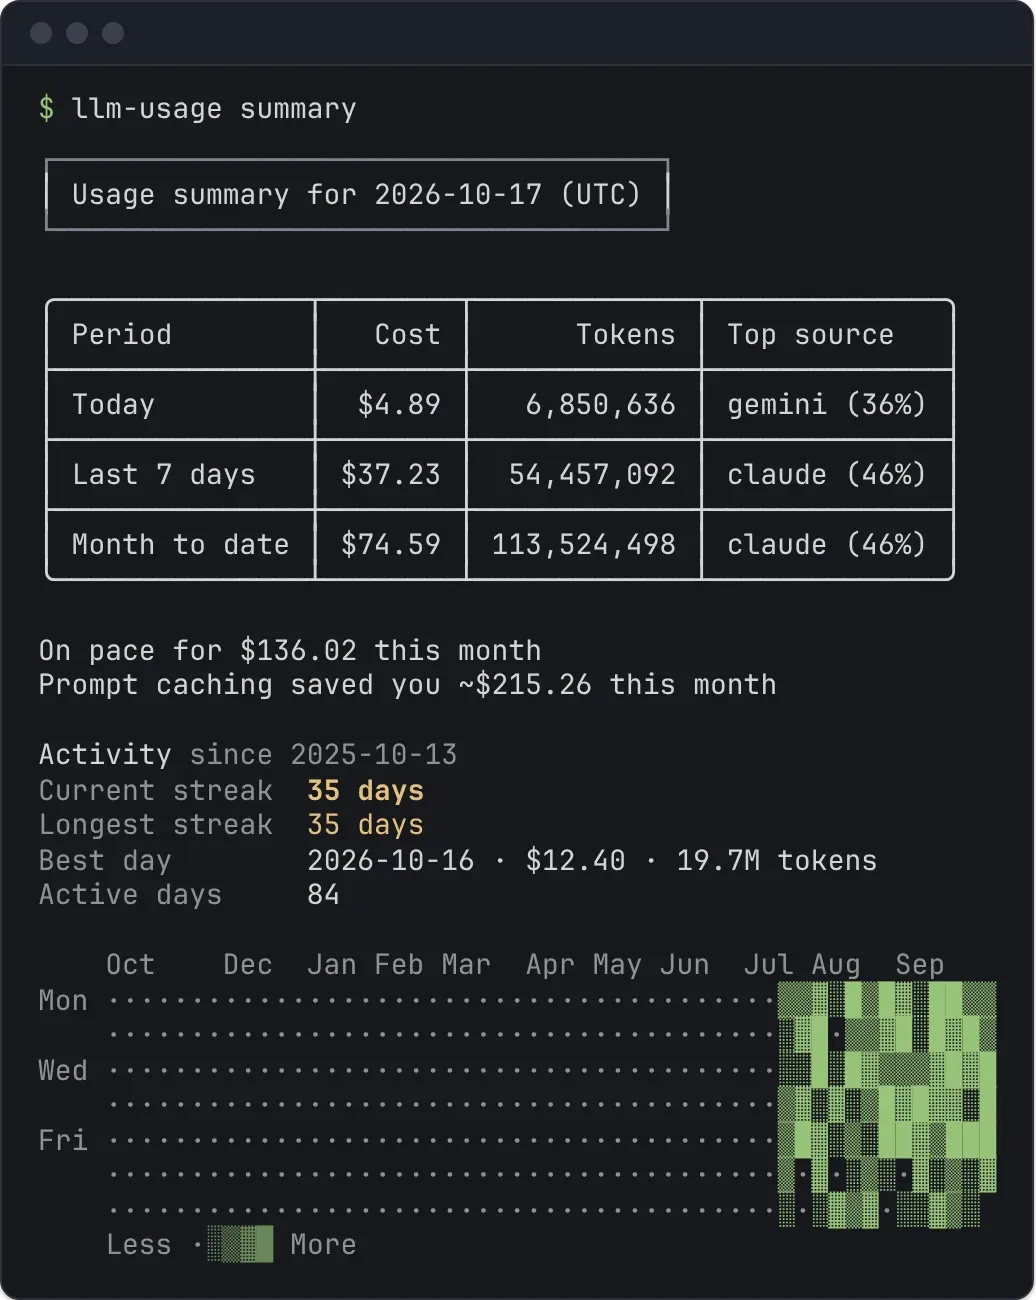
llm-usage on demo data17 agents.
One reporting language.
Each tool’s logs are read in place and turned into the same events, so every report covers all of them.
Check paths & setup →See which project the tokens went to.
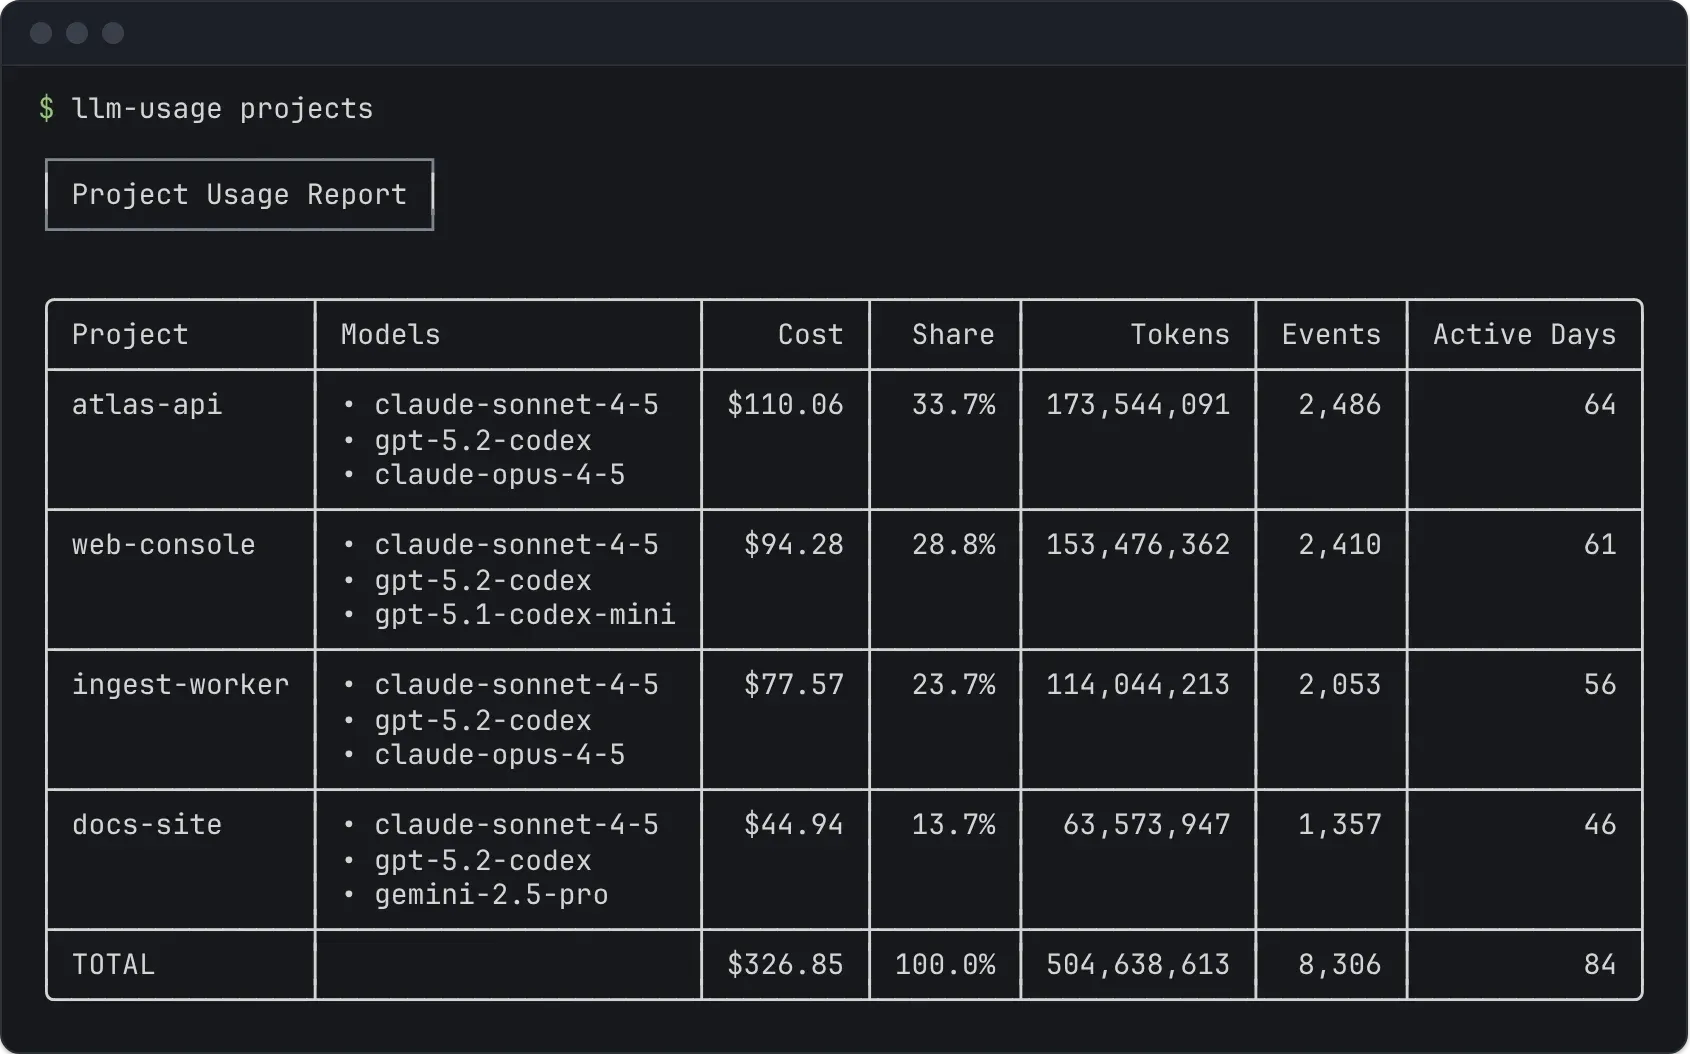
Every session records the folder it ran in. llm-usage projects ranks those projects by cost, with their models, share of the cost, events, and active days.
--by-reposplits hourly, daily, weekly, monthly, compare, session, and trends by project--repo atlas-apikeeps one project in most reports, by name or by pathllm-usage valueshows each month’s projects next to your subscription’s price
Open any report as an interactive page.
Add --share to summary, daily, weekly, monthly, compare, trends, wrapped, efficiency, or optimize. The CLI writes one HTML file you can filter by source, model, and project, regroup by hour, day, week, or month, and export chart by chart. The file loads nothing from the network, and --redact replaces project and machine names before you send it on.
llm-usage daily --last 90 --share on generated demo data: four sources, four projects, 90 days.Open it full page Your laptop, your desktop, your dev box. One report.
Add a machine you can reach over ssh and its usage joins every report. Each machine parses its own logs; a session that reached two of them through a synced folder counts once.
Usage also outlives the logs. Tools delete old transcripts, but the local ledger keeps what they counted, so last quarter still adds up.
Set up machines → llm-usage machine add laptop
llm-usage monthly --by-machine
| Source | Tokens | Cost (USD) |
|---|---|---|
| claude (local) | 18,240,000 | $96.10 |
| claude (laptop) | 9,880,000 | $51.37 |
| codex (devbox) | 6,410,000 | $14.82 |
| TOTAL | 34,530,000 | $162.29 |
Start with what you want to know.
All reports →How am I doing this month?
Today, the last 7 days, and the month at a glance, with your streak and a month-end projection.
llm-usageWhere did the tokens go?
Hourly, daily, weekly, and monthly totals by source, with model breakdowns and estimated cost.
llm-usage dailyWhich project costs the most?
Every project in your history, costliest first, with its models and active days.
llm-usage projectsWhich conversations used the most?
Rank sessions by cost, or group them into one row per project.
llm-usage session --top 10What changed this month?
Two periods side by side: tokens, cost, events, and active days, with the deltas.
llm-usage compareIs usage climbing?
A daily series over a chosen window, combined, by source, or by project.
llm-usage trends --metric tokens --last 14How much of this window is left?
Estimated 5-hour windows per source, with the active block’s time left and burn rate.
llm-usage blocksIs the subscription worth it?
Each month priced at API rates next to a plan’s monthly price, split by project.
llm-usage valueWhat is this session costing?
Today, your streak, and the month in Claude Code, tmux, or starship, plus the session cost in Claude Code.
llm-usage statuslineDoes usage line up with your commits? Check efficiency. Want a year in review? Try Wrapped. Need individual events? Export JSONL or CSV.
A parsing library under a reporting CLI.
The 17 source adapters live in @ayagmar/agent-sessions, a package with no runtime dependencies that finds the logs, reads them, and yields one event shape. The CLI adds the event store, pricing, other machines, and the reports.
Useful numbers.
Visible limits.
Usage reports help you understand your tools. Source logs, pricing coverage, and attribution determine what each number can tell you.
How pricing works →- Your sessions stay on your machines
- Parsing and reporting happen on your machines, and other machines are reached only over your own ssh. Online runs fetch pricing and check npm for updates; neither request includes your usage. Read the privacy page.
- Cost coverage is explicit
- Source-recorded cost is kept. Other events use available model pricing. A tilde marks partial cost; a dash means unresolved cost. Estimates may differ from your bill.
- Keep the data useful outside the terminal
- Export versioned JSON, Markdown, normalized events, or an interactive HTML report. Diagnostics stay separate from report data. Choose an output format.
Your first report is one command away.
Try it without installing. Standard source locations are discovered automatically.
Open the setup guide →npx --yes llm-usage-metrics@latestAlready installed, but seeing an empty report?
llm-usage doctorFind the cause →