
What changed in my CI?
runnerd reads its job history for what changed in your CI. Notifications send them to a phone or a webhook.
Insights
Section titled “Insights”A job is its repository, workflow and job name. Notifications send warnings, not notices.
| Insight | When |
|---|---|
slower |
The median of a job’s last 5 successful runs on main or master is 20% and 30 s or more above the median of the runs before, and each of the 5 is slower than it. |
flaky |
A job failed or timed out, then passed on a re-run. Once is a notice, twice a warning. |
near-cap |
The p95 of a job’s memory peaks over its last 10 runs is 85% or more of its profile’s memory. A notice when auto sizing raises it, else a warning. |
cold-cache |
At least 3 of a job’s last 5 runs that could write to the build cache looked up 10 or more entries and found 10% or less. A notice. |
throttled |
The kernel throttled the downloads (sock_throttled) of 2 or more of a repository’s jobs. A warning. |
cpu-held |
At least 3 of a job’s last 10 successful runs were throttled by the CPU quota in 15% of their run or more. A notice while auto sizing raises cpus, else a warning. |
host-held |
A queued job has waited 30 minutes or more for the host’s memory while the host lacks room for a job that waits now. A warning, with the longest wait and the programs outside CI that hold the most memory; closing them frees only part of that figure. Sent at most once in each 6-hour window. |
host-low |
On a day CI ran, the host had under a tenth of its memory available while a host credit stood. A warning, at most once a day, naming pooled_count = false as the way back. |
waits |
A repository’s p95 wait this week is half again and a minute more than last week’s. A notice (how a wait is counted). |
$ runnerctl insightsThis month: 277 job-minutes here, about $1.66 at GitHub's 2-core Linux rate before your plan's free minutes (1 job not priced)  277 minutes of 30 jobs at actions_linux (2-core Linux, $0.006 a minute): $1.66  1 job not priced: lost, so how long they ran is not known  An estimate from this machine's run times, at each profile's priced_as and each repository's visibility as they are now; on GitHub's runners the jobs would run longer or shorterLast 30 days: 277 job-minutes here, about $1.66 at GitHub's 2-core Linux rate before your plan's free minutes (1 job not priced)  277 minutes of 30 jobs at actions_linux (2-core Linux, $0.006 a minute): $1.66  1 job not priced: lost, so how long they ran is not known  An estimate from this machine's run times, at each profile's priced_as and each repository's visibility as they are now; on GitHub's runners the jobs would run longer or shorter
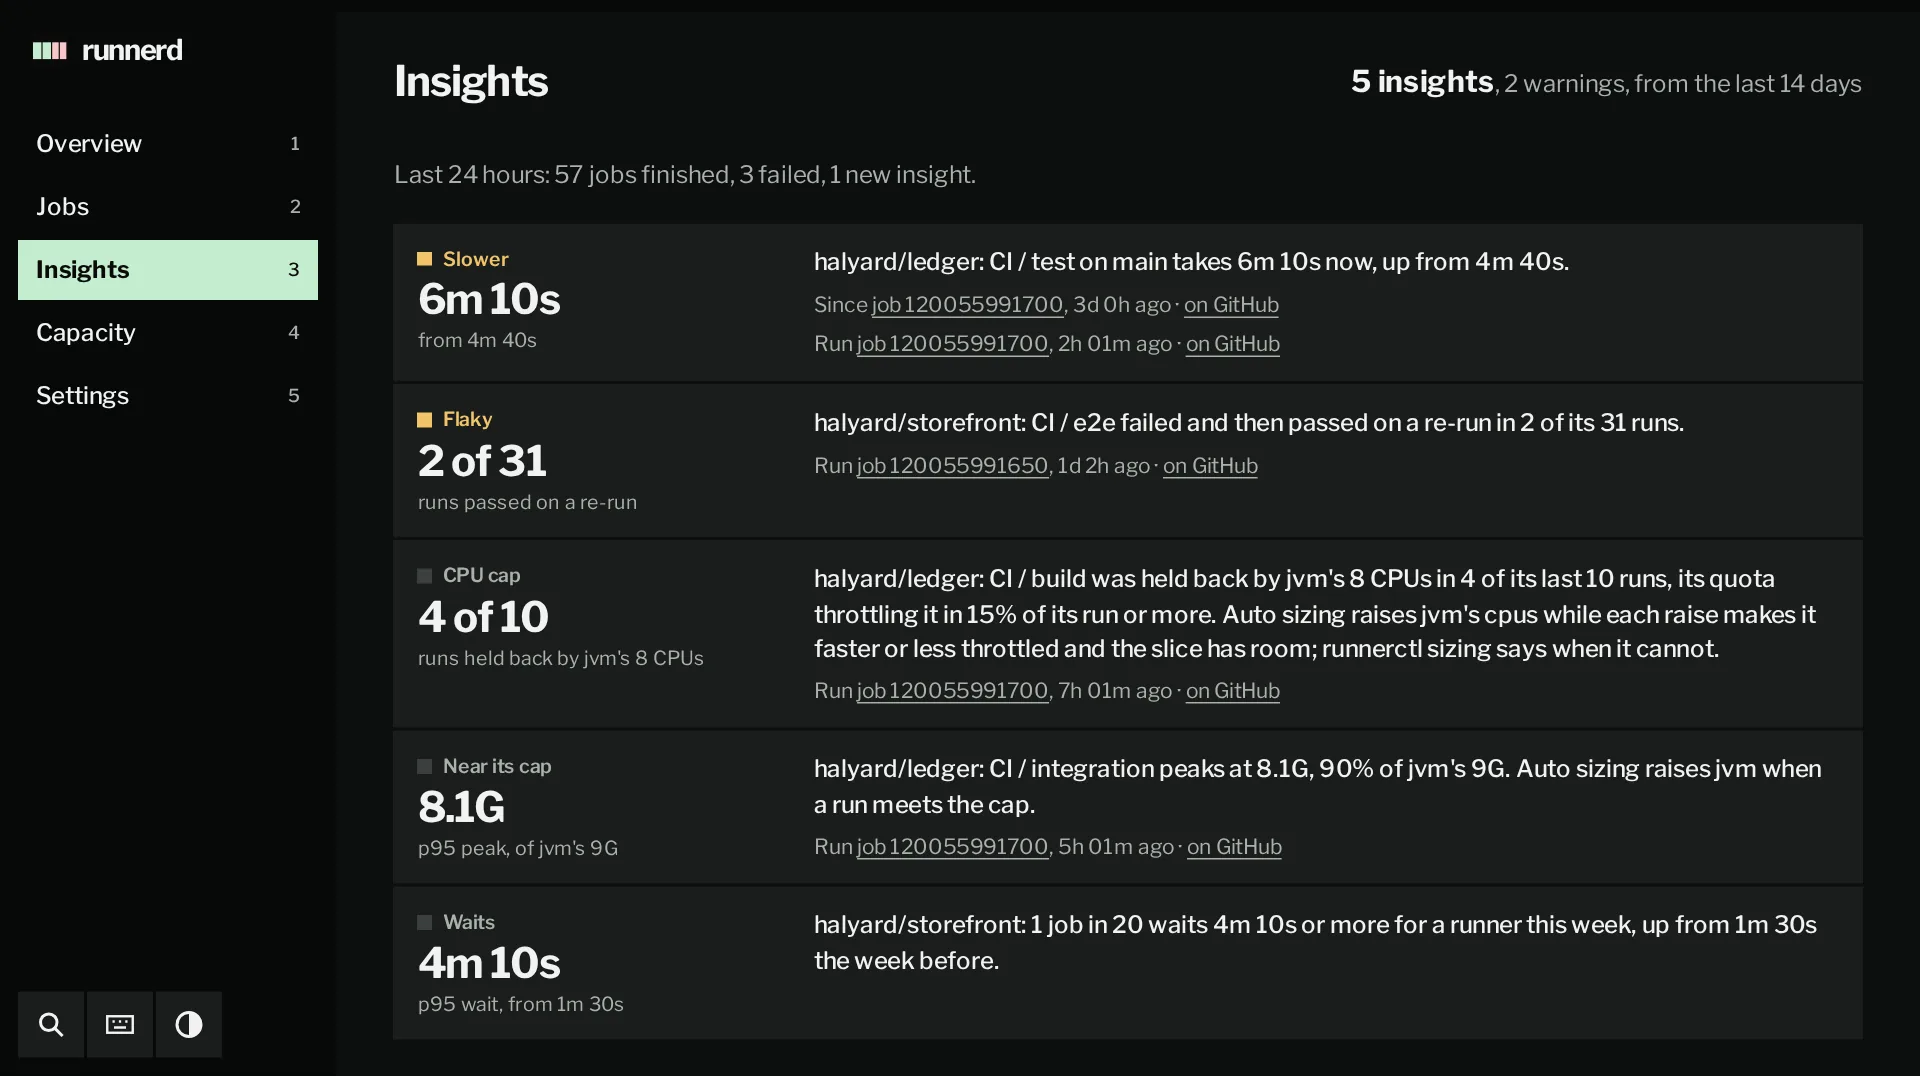
warning slower    halyard/ledger: CI / test on main takes 6m 10s now, up from 4m 40s.warning flaky     halyard/storefront: CI / e2e failed and then passed on a re-run in 2 of its 31 runs.notice  cpu-held  halyard/ledger: CI / build was held back by jvm's 8 CPUs in 4 of its last 10 runs, its quota throttling it in 15% of its run or more. Auto sizing raises jvm's cpus while each raise makes it faster or less throttled and the slice has room; runnerctl sizing says when it cannot.notice  near-cap  halyard/ledger: CI / integration peaks at 8.1G, 90% of jvm's 9G. Auto sizing raises jvm when a run meets the cap.notice  waits     halyard/storefront: 1 job in 20 waits 4m 10s or more for a runner this week, up from 1m 30s the week before.
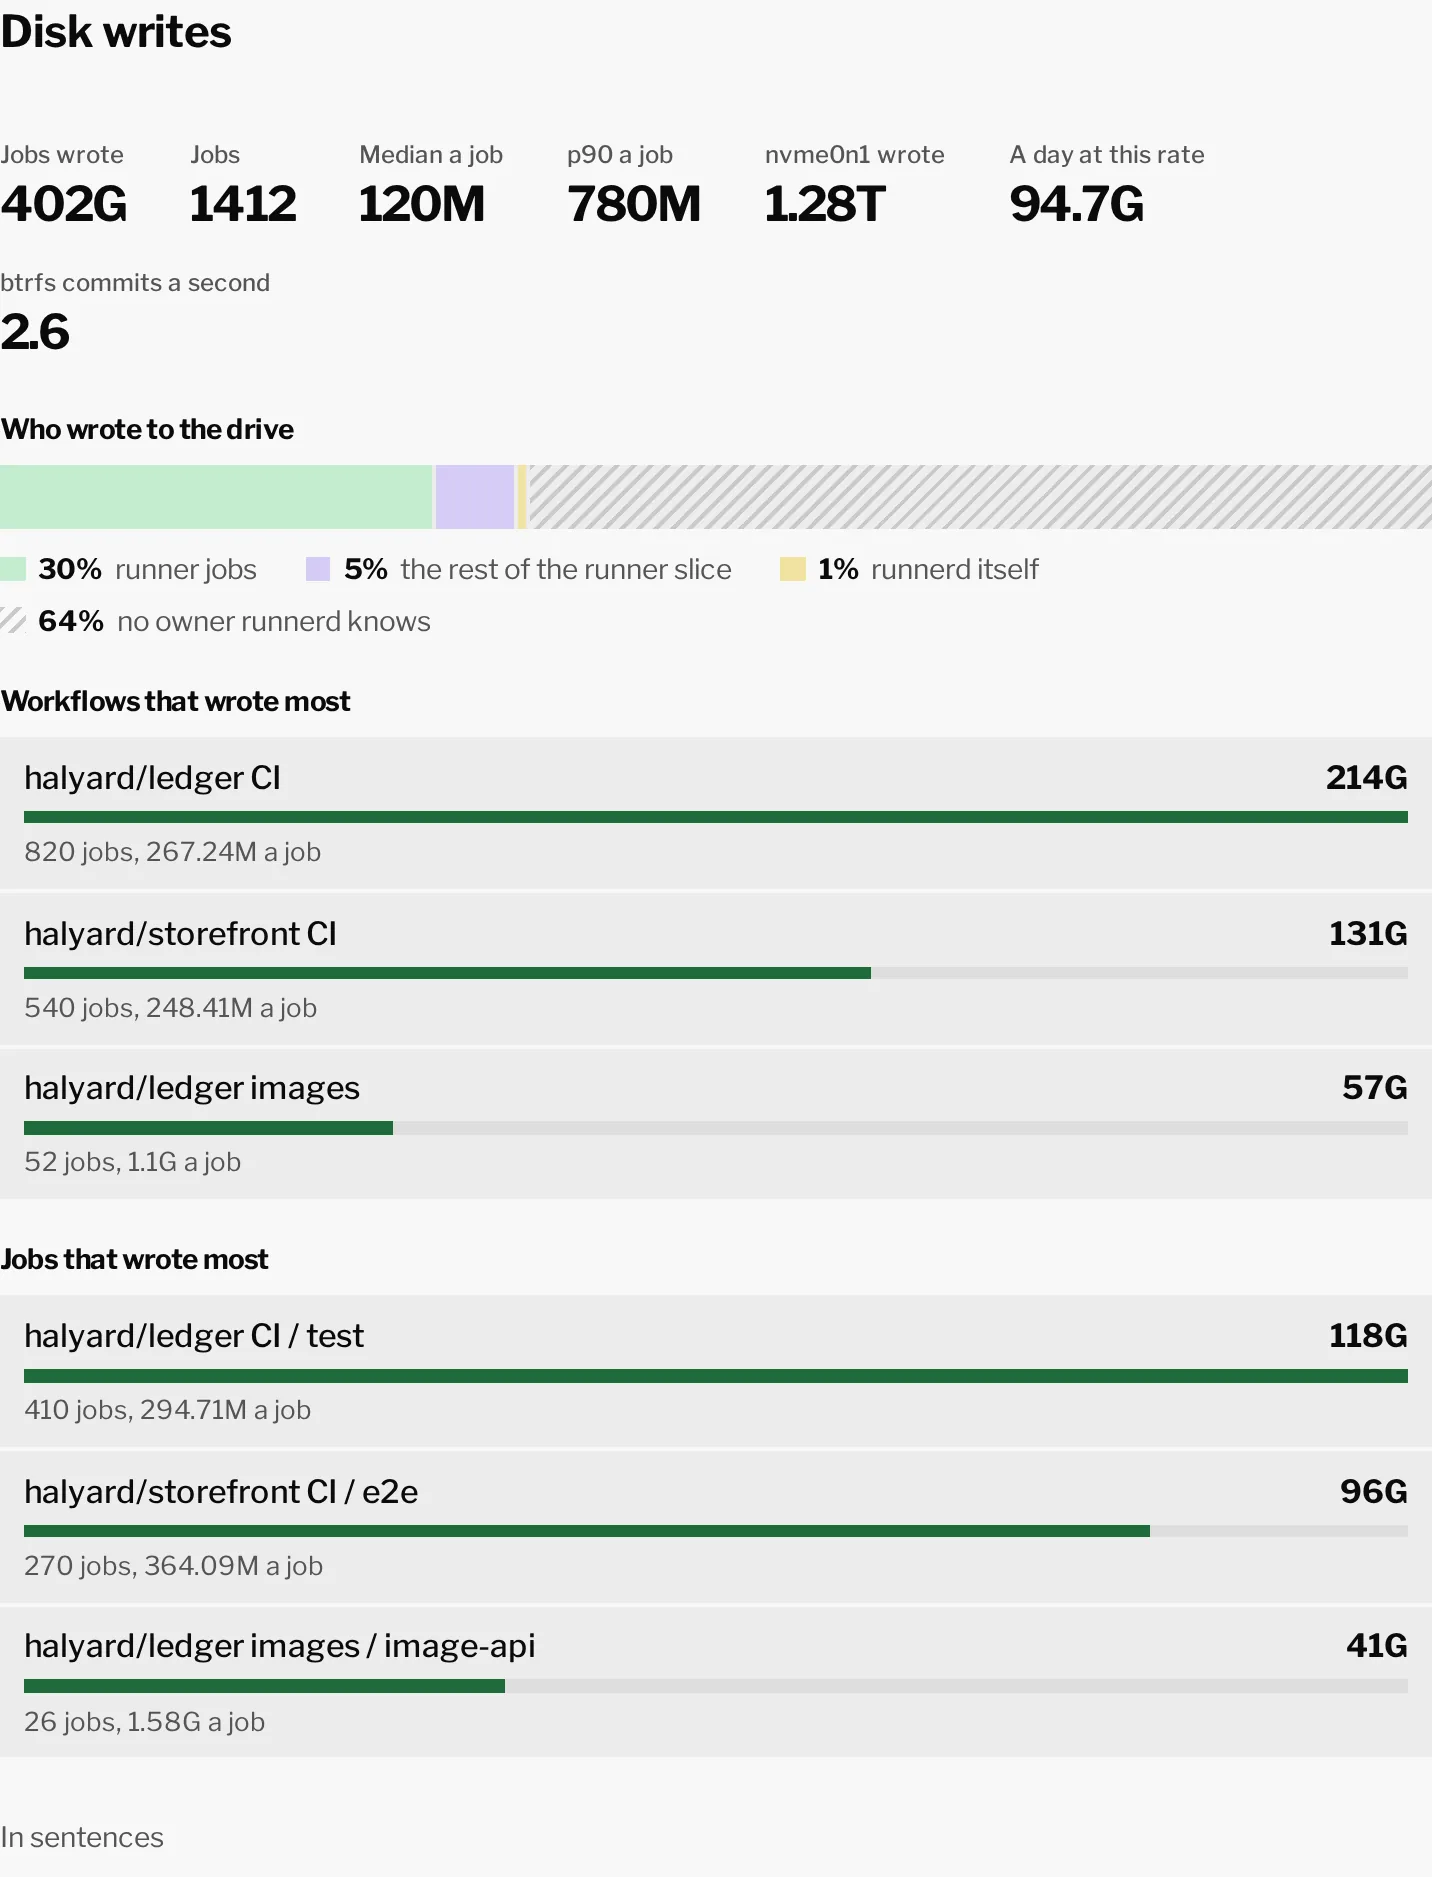
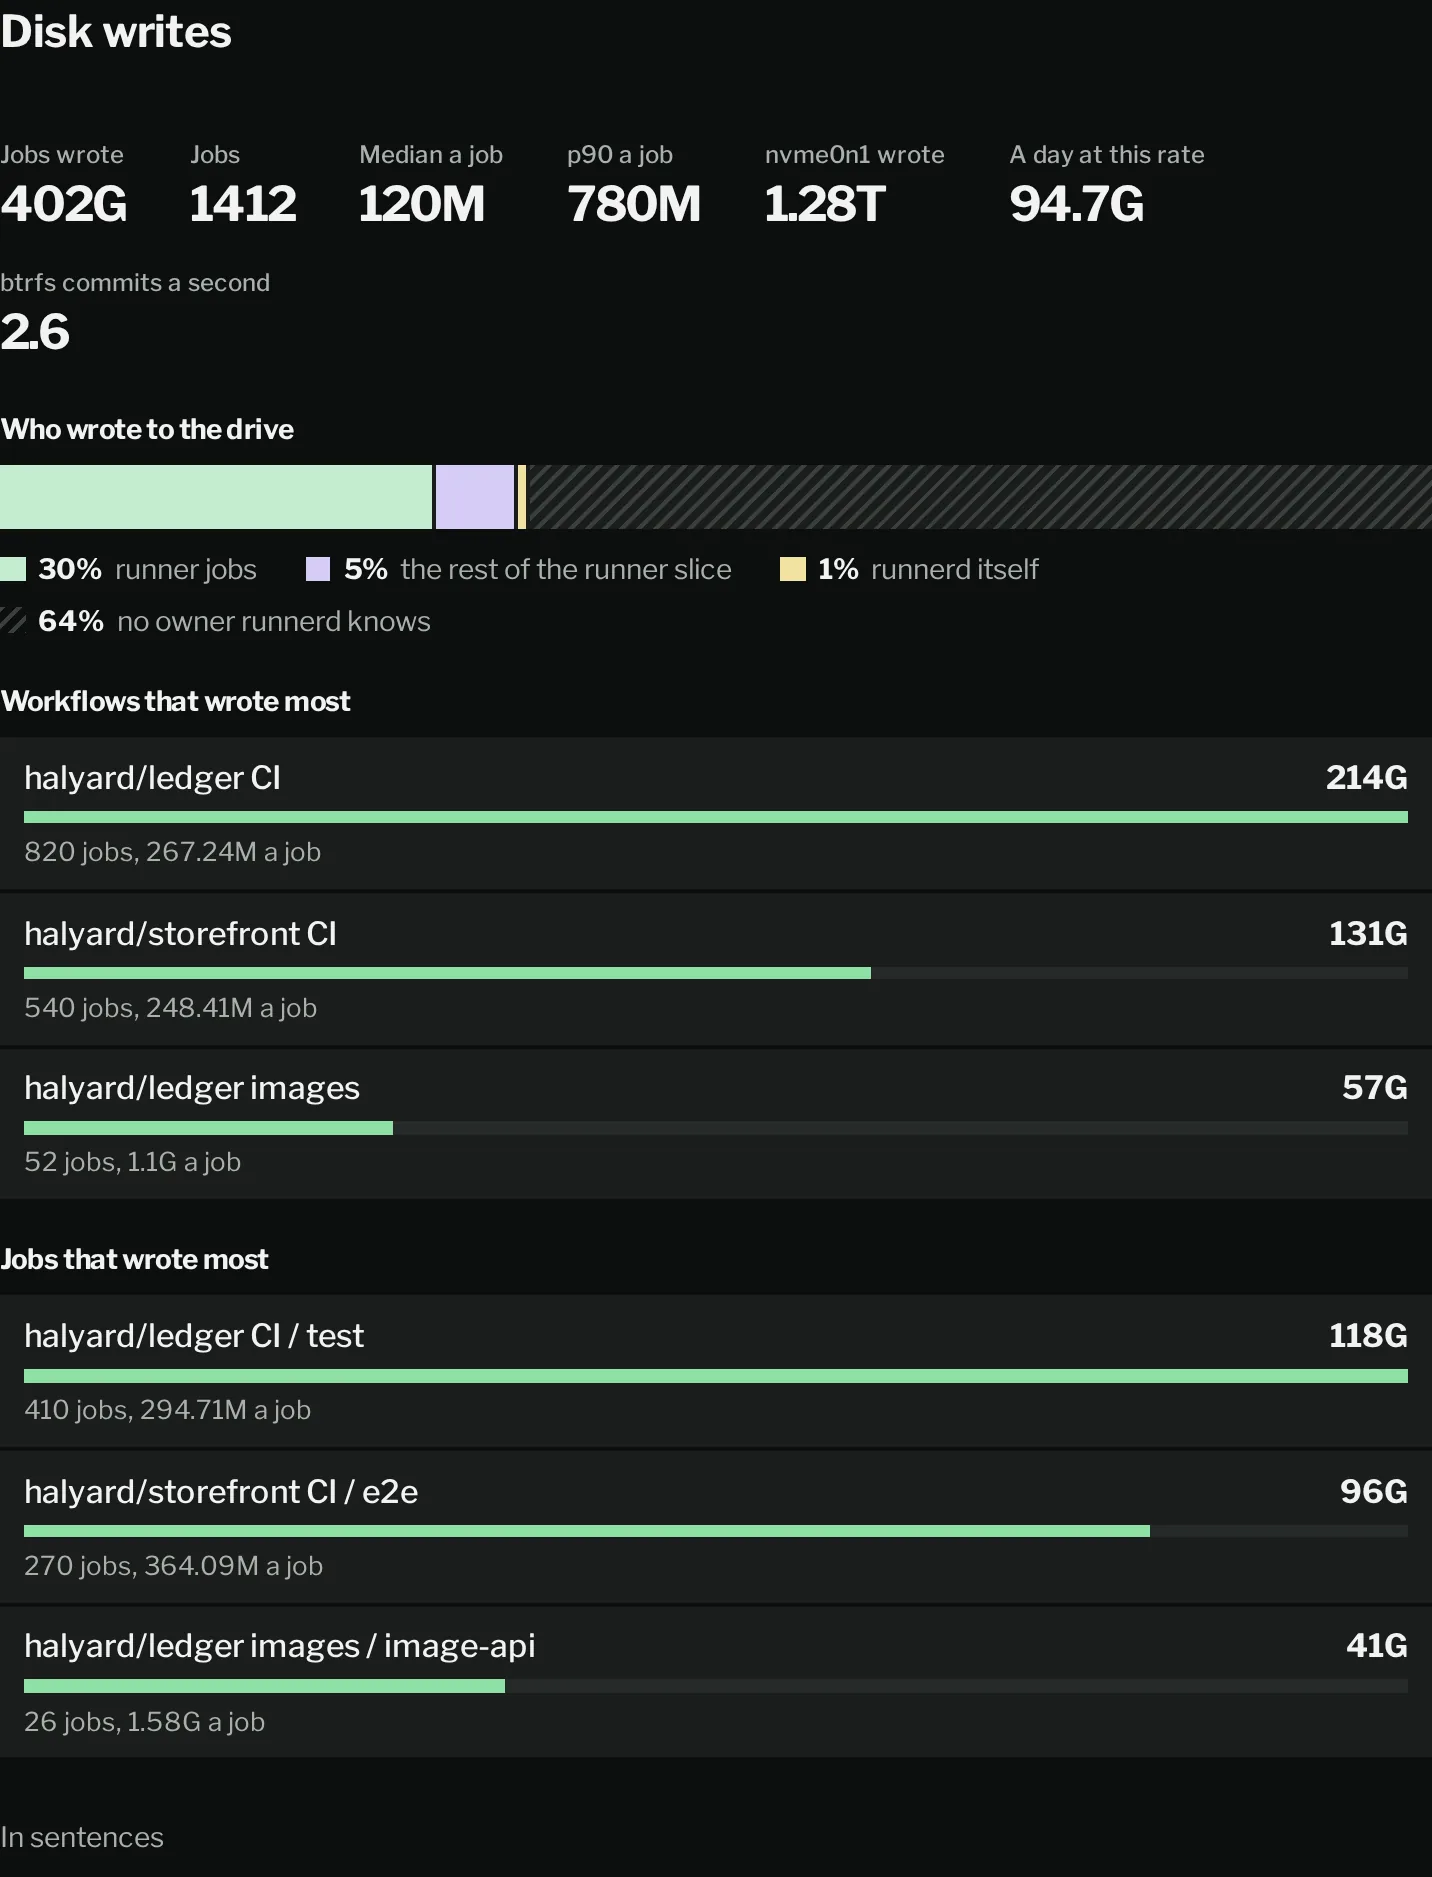
disk writes:  Jobs:    1412 jobs wrote 402G: median 120M, p90 780M a job; 9 partial, counted as far as read; 6G more waited to be written back as their containers ended  Drive:    nvme0n1 wrote 1.28T over the 13d 20h runnerd read it: 94.7G a day at this rate    Runner jobs 30%; the rest of the runner slice 5% (seeds, the mirror, runners before and after their jobs, write-back after a container ended); runnerd itself 1%; no owner runnerd knows 64%    btrfs committed 2.6 times a second  Workflows that wrote most:    halyard/ledger CI: 214G over 820 jobs, 267.24M a job    halyard/storefront CI: 131G over 540 jobs, 248.41M a job    halyard/ledger images: 57G over 52 jobs, 1.1G a job  Jobs that wrote most:    halyard/ledger CI / test: 118G over 410 jobs, 294.71M a job    halyard/storefront CI / e2e: 96G over 270 jobs, 364.09M a job    halyard/ledger images / image-api: 41G over 26 jobs, 1.58G a job
why jobs queued:  jvm: 42 jobs waited 12h 31m in all; 3 jobs from before runnerd counted why are left out; 2 jobs' causes are estimates, scaled into their waits    WAITED FOR                   TIME  SHARE    Host memory                6h 10m    49%    Behind a barrier           2h 30m    20%    No free slot               1h 45m    14%    Runner starting           21m 00s     3%    Before runnerd listed it  14m 00s     2%    No plan covered            1h 31m    12%  node: 1 job waited 1m 35s in all    WAITED FOR                  TIME  SHARE    Memory budget             1m 00s    63%    Before runnerd listed it     35s    37%  light: 1 job ended from before runnerd counted why jobs wait
REPOSITORY          JOBS  WAIT P50     P95  WARM P50  COLD P50  P95 WEEK BEFOREhalyard/ledger       184        3s     41s        2s       24s              44shalyard/storefront   212        9s  4m 10s        2s       47s           1m 30s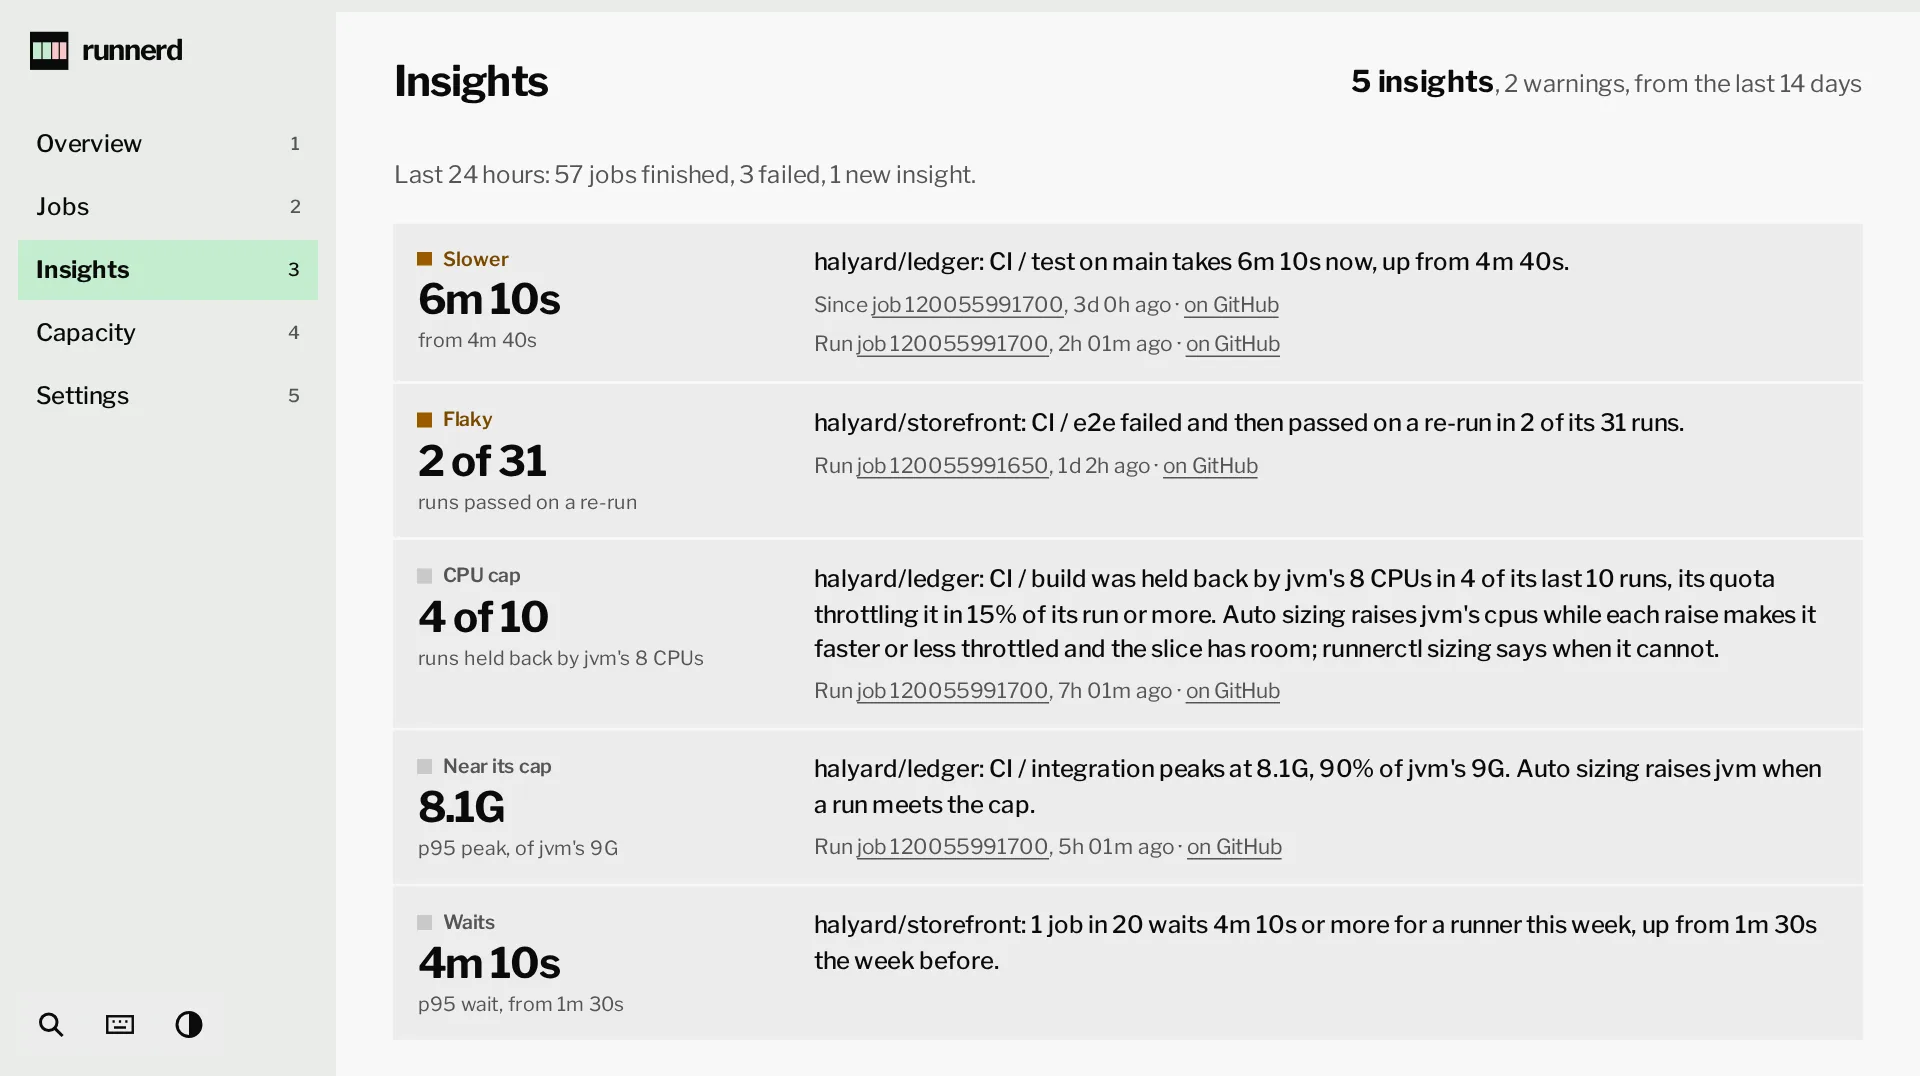
--days N sets the window (default 14, at most 90); --digest shows the last 24 hours.
The host’s memory while CI ran
Section titled “The host’s memory while CI ran”Below the insights, runnerctl insights and the dashboard list each UTC day a runner ran, and the digest gives its 24 hours, from the readings runnerd stored:
host memory while CI ran: Nov 6: CI ran 9h 12m, 6h 10m of it on a host credit; under 19.4G available for 1h 04m (41m on a credit); under 6.2G available for 34s (34s on a credit); lowest 4.1G (4.5G on a credit); swap free at least 8.2GThe lines are the host’s margin plus a quarter of its memory, and a tenth of its memory: 19.4G and 6.2G on a 62G host. Each reading counts until the next for a minute at most, so time runnerd was down is not counted.
Disk writes
Section titled “Disk writes”Next, runnerctl insights and the dashboard say what the window’s jobs wrote to the disk under Docker’s root, which workflows and jobs wrote most, and what that disk wrote while runnerd read it. The dashboard draws it as figures, a bar of who wrote to the drive and ranked bars, with the sentences in a fold:
runnerctl insights prints the same:
disk writes: Jobs: 529 jobs wrote 145G: median 49M, p90 612M a job; 12 partial, counted as far as read; 3G more waited to be written back as their containers ended Drive: nvme0n1 wrote 574G over the 6h 36m runnerd read it: 2.04T a day at this rate Runner jobs 24%; the rest of the runner slice 7% (seeds, the mirror, runners before and after their jobs, write-back after a container ended); no owner runnerd knows 68% btrfs committed 2.0 times a second Workflows that wrote most: halyard/ledger CI: 99G over 426 jobs, 237.97M a job Jobs that wrote most: halyard/ledger images / image-app: 13G over 5 jobs, 2.6G a job- A job’s figure is its runner container’s cgroup
io.stat, which counts what its Docker Engine and that engine’s containers write too. It starts at the last reading before the job, so a warm runner’s start is not the job’s, and ends at the container’s last reading, at most 4 s before it ended. A job is partial when its end, or its start, was not read, or its container was started again; a host without the io controller has no figure. - Only the disks under Docker’s root count: a partition counts as its whole disk; swap on zram does not count.
- When Docker’s root is a file system in a file, on a loop device, the jobs’ and the runner slice’s figures are bytes written to that file system, and the drive is the disk the file is on. The drive writes more than that for them: the inner file system’s journal and the outer one’s overhead. The drive section then says so in a line.
- Pages still in memory when a container ends are written after it, to the runner slice’s account, as is what seeds and the mirror write.
- runnerd itself: what the daemon wrote, its history, logs and build cache among it.
- No owner: the disk’s writes outside the runner slice and runnerd, from the system, other programs and the file system’s own work. btrfs commits appear only on btrfs.
- When a reading of the runner slice failed, its shares are over the time it was read, and the line says how long that was.
- The drive is read in windows of up to 10 minutes; the time runnerd was stopped is in none, and the daily rate is over the time read.
Why jobs queued
Section titled “Why jobs queued”Then each profile’s queue time over the window, split by what held its jobs. Each plan that holds a queued job adds the time to the next plan to the reason it gave, as runnerctl status words it:
$ runnerctl insights[...]why jobs queued: jvm: 42 jobs waited 12h 31m in all; 3 jobs from before runnerd counted why are left out; 2 jobs' causes are estimates, scaled into their waits WAITED FOR TIME SHARE Host memory 6h 10m 49% Behind a barrier 2h 30m 20% No free slot 1h 45m 14% Runner starting 21m 00s 3% Before runnerd listed it 14m 00s 2% No plan covered 1h 31m 12% node: 1 job waited 1m 35s in all WAITED FOR TIME SHARE Memory budget 1m 00s 63% Before runnerd listed it 35s 37% light: 1 job ended from before runnerd counted why jobs wait| Cause | The plan held the job because |
|---|---|
| Behind a barrier | An older job waited long enough for memory or CPU that no younger one starts before it. |
| Behind an older job’s start | An older job’s runner starts first and takes the room. |
| No free slot | Every slot of its profile holds a runner. |
| Memory budget | Its runner does not fit the slice’s memory budget. |
| Host memory | Its runner does not fit what the host’s memory has to spare. |
| CPU budget | Its runner does not fit the CPU budget. |
| Runner starting | A runner is up or starting for it, waiting for GitHub to hand it a job. |
| Snapshot, image or cleanup | Its profile rebuilds its snapshot, pulls its image, or empties caches a host crash may have torn. |
| Repository paused, Runners failing, No profile serves it | Something for you to act on. |
Two parts no cause covers are named rather than spread over the causes. Before runnerd listed it: from GitHub queueing the job to runnerd’s first listing of it. No plan covered: after a restart until the first plan, and between a planned start and its runner. Time runnerd was stopped is left out of the wait, as in how a wait is counted. Jobs that ended before runnerd counted causes are left out and counted apart, never as a wait of 0.
A cause that goes on is written when it changes or ends, and at the first plan 5 minutes after the last such write, so the history is not rewritten at every plan. A crash loses at most those 5 minutes plus the time to the next plan, about poll_interval; any asked-for stop, a detach included, writes every open cause first. When a job’s causes come to more than its wait after the listing, as when GitHub started it before runnerd saw the take, they are scaled to fit, and the line says how many jobs’ causes are estimates.
To ask the job history directly, each job’s wait_causes holds milliseconds by cause:
sqlite3 "file:$HOME/.local/state/runnerd/runnerd.db?mode=ro" \ 'SELECT key, sum(value) / 1000 AS seconds FROM jobs, json_each(jobs.wait_causes) GROUP BY key'What the minutes would have cost
Section titled “What the minutes would have cost”runnerctl insights opens with what this machine’s job minutes would have cost on GitHub-hosted runners, this month (UTC) and over the last 30 days. Each job is billed as GitHub bills it: minutes rounded up, at the rate of the runner its profile’s priced_as names. Not counted:
- Jobs of public repositories on a standard runner, which GitHub runs free, and of repositories whose visibility is unknown.
- Jobs named
Dependabot Updatesorpages build and deployment, which GitHub runs free; a name is not proof, so they are neither priced nor called free. - Lost jobs and jobs without a start or end.
The figure is before your plan’s included minutes. When pruning has dropped jobs a window covers, the line says since when the history is complete.