
Watch it
Three clients read the same daemon: the dashboard in a browser, runnerctl tui in a terminal, and runnerctl for scripts. They show the same figures in the same words. Shots and output here come from a demo daemon running the example config with a third profile, small, and measured and CPU admission on.
The dashboard
Section titled “The dashboard”runnerd serve serves it on 127.0.0.1:7477; --web <address> picks another loopback address, --web off serves none. A browser signs in once through a one-time link the daemon keeps in $XDG_RUNTIME_DIR/runnerd.web:
runnerctl web# without runnerctlxdg-open "$(head -n 1 "$XDG_RUNTIME_DIR/runnerd.web")"The browser stays signed in for 30 days after its last visit. Memory and CPU are sampled every 2 s, so a shorter peak does not show. Security model says how sessions end; On another device puts it on a phone.
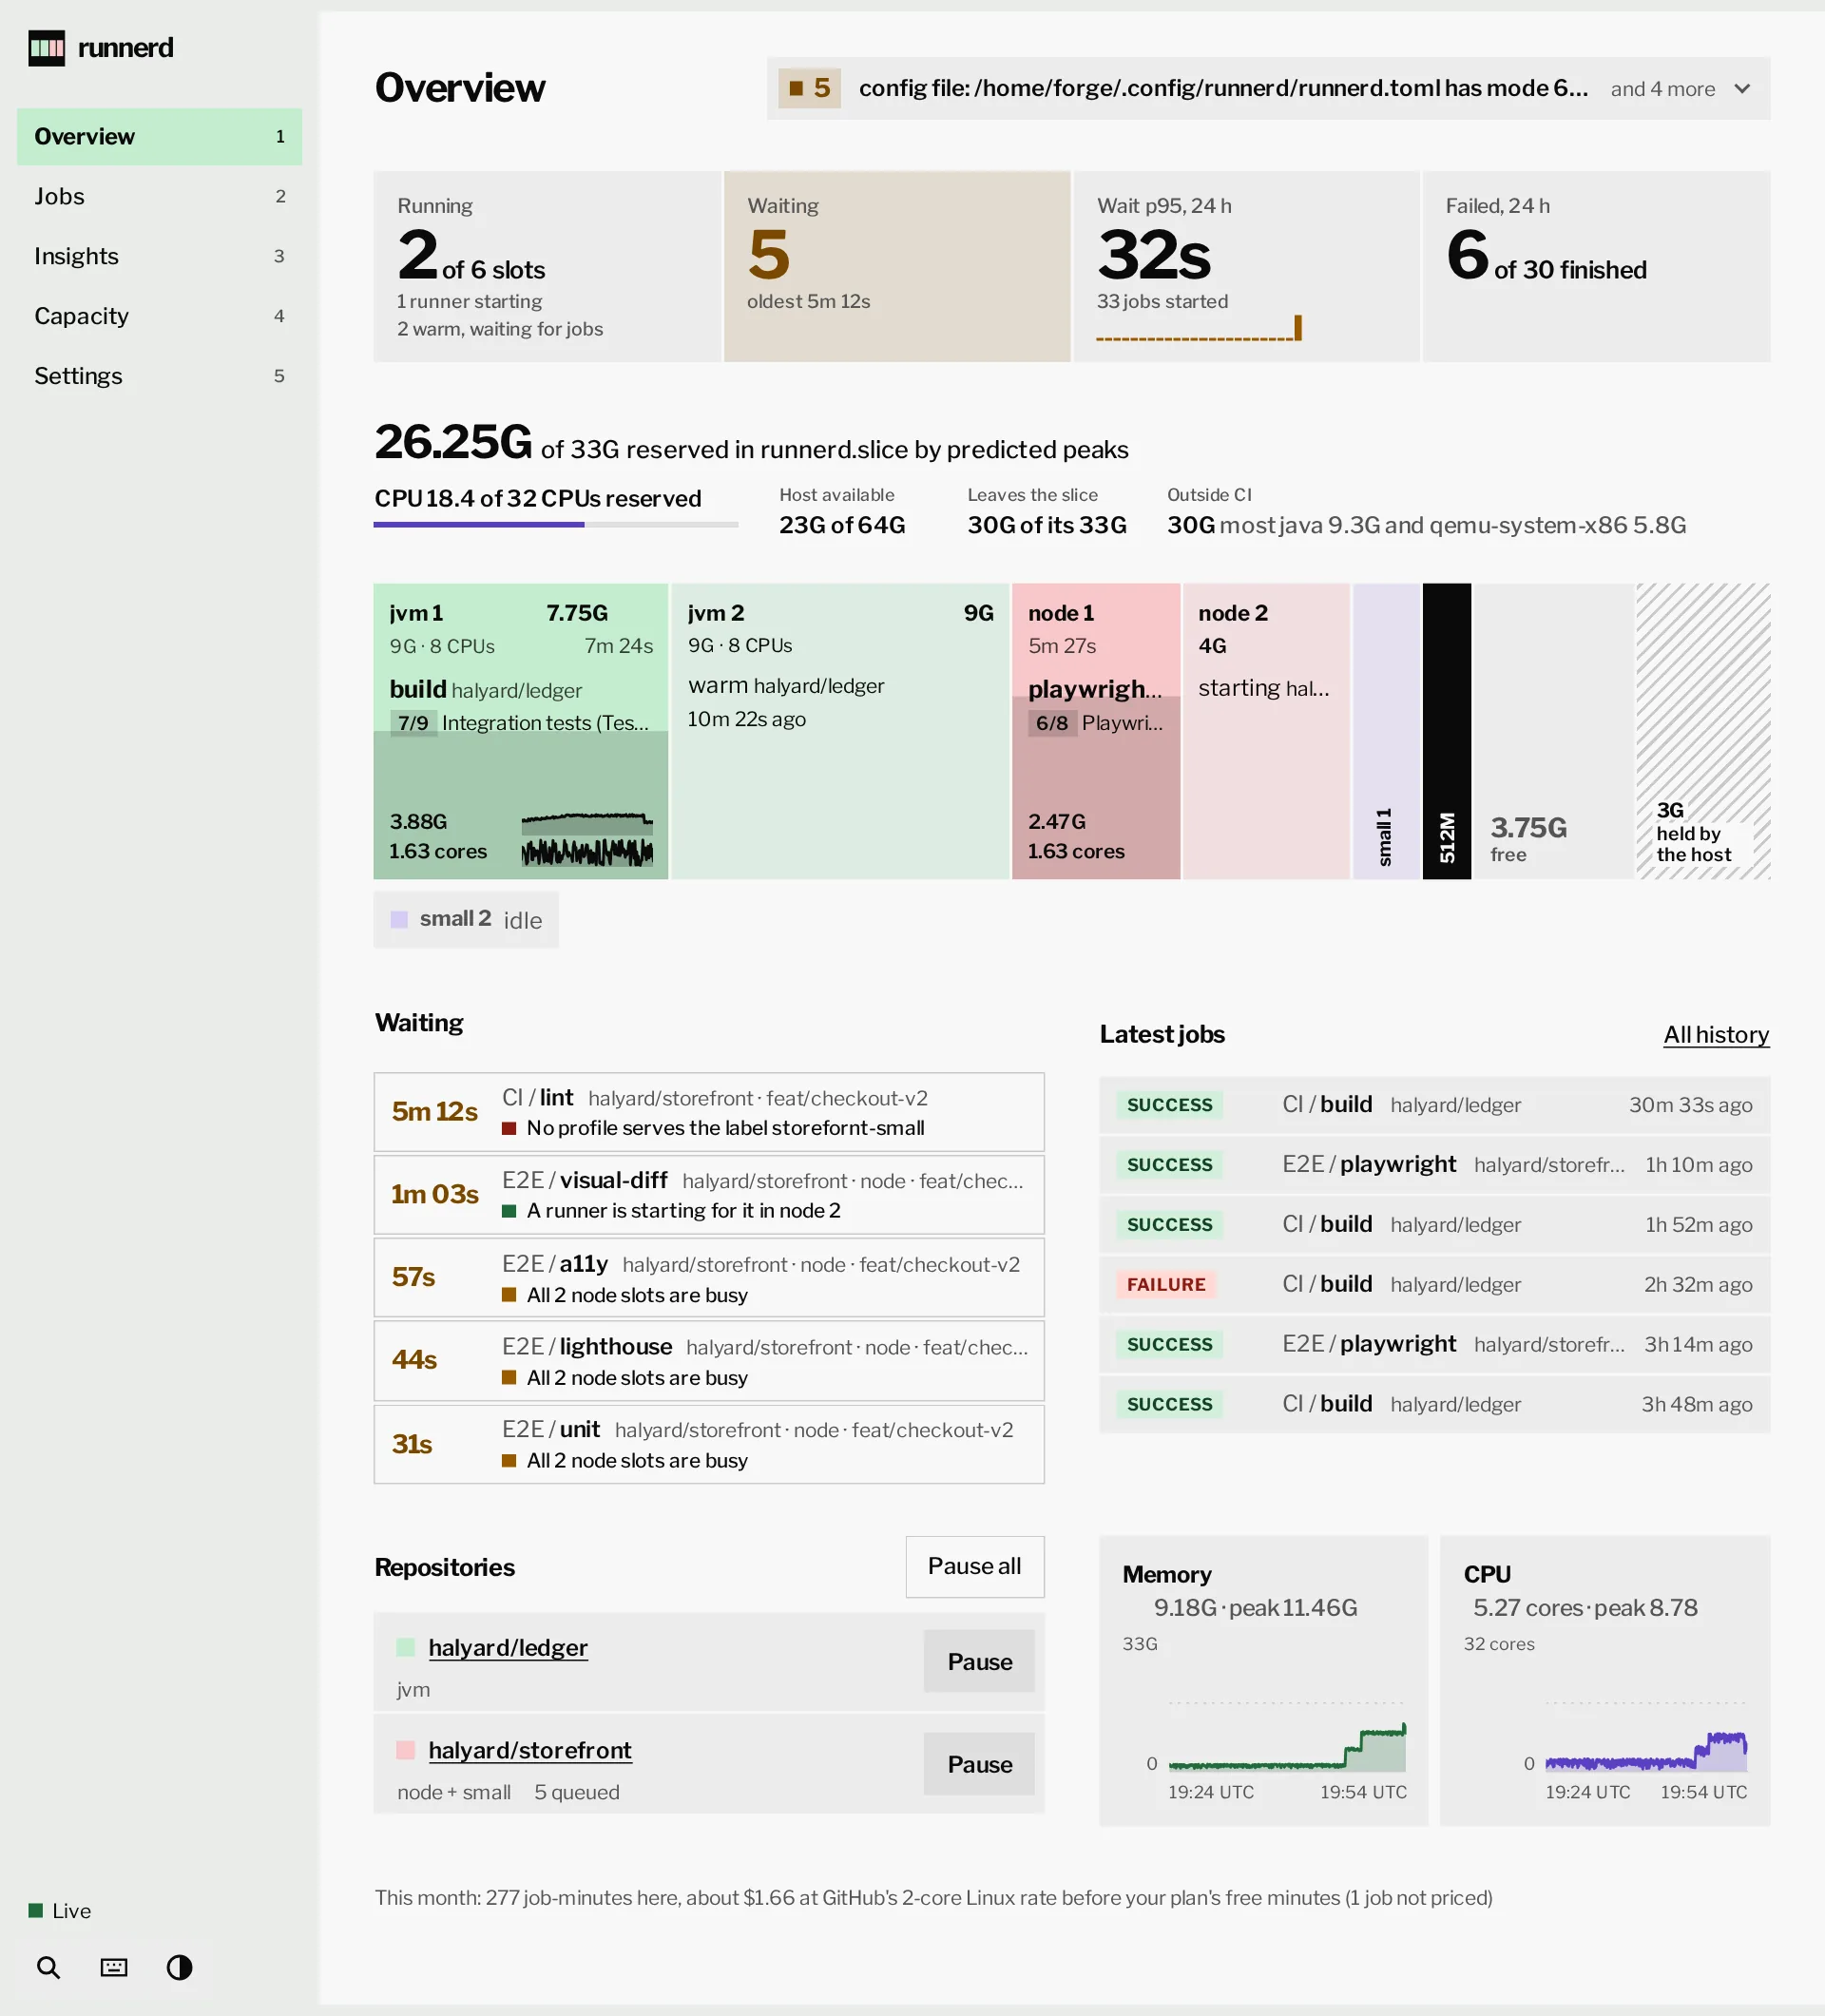
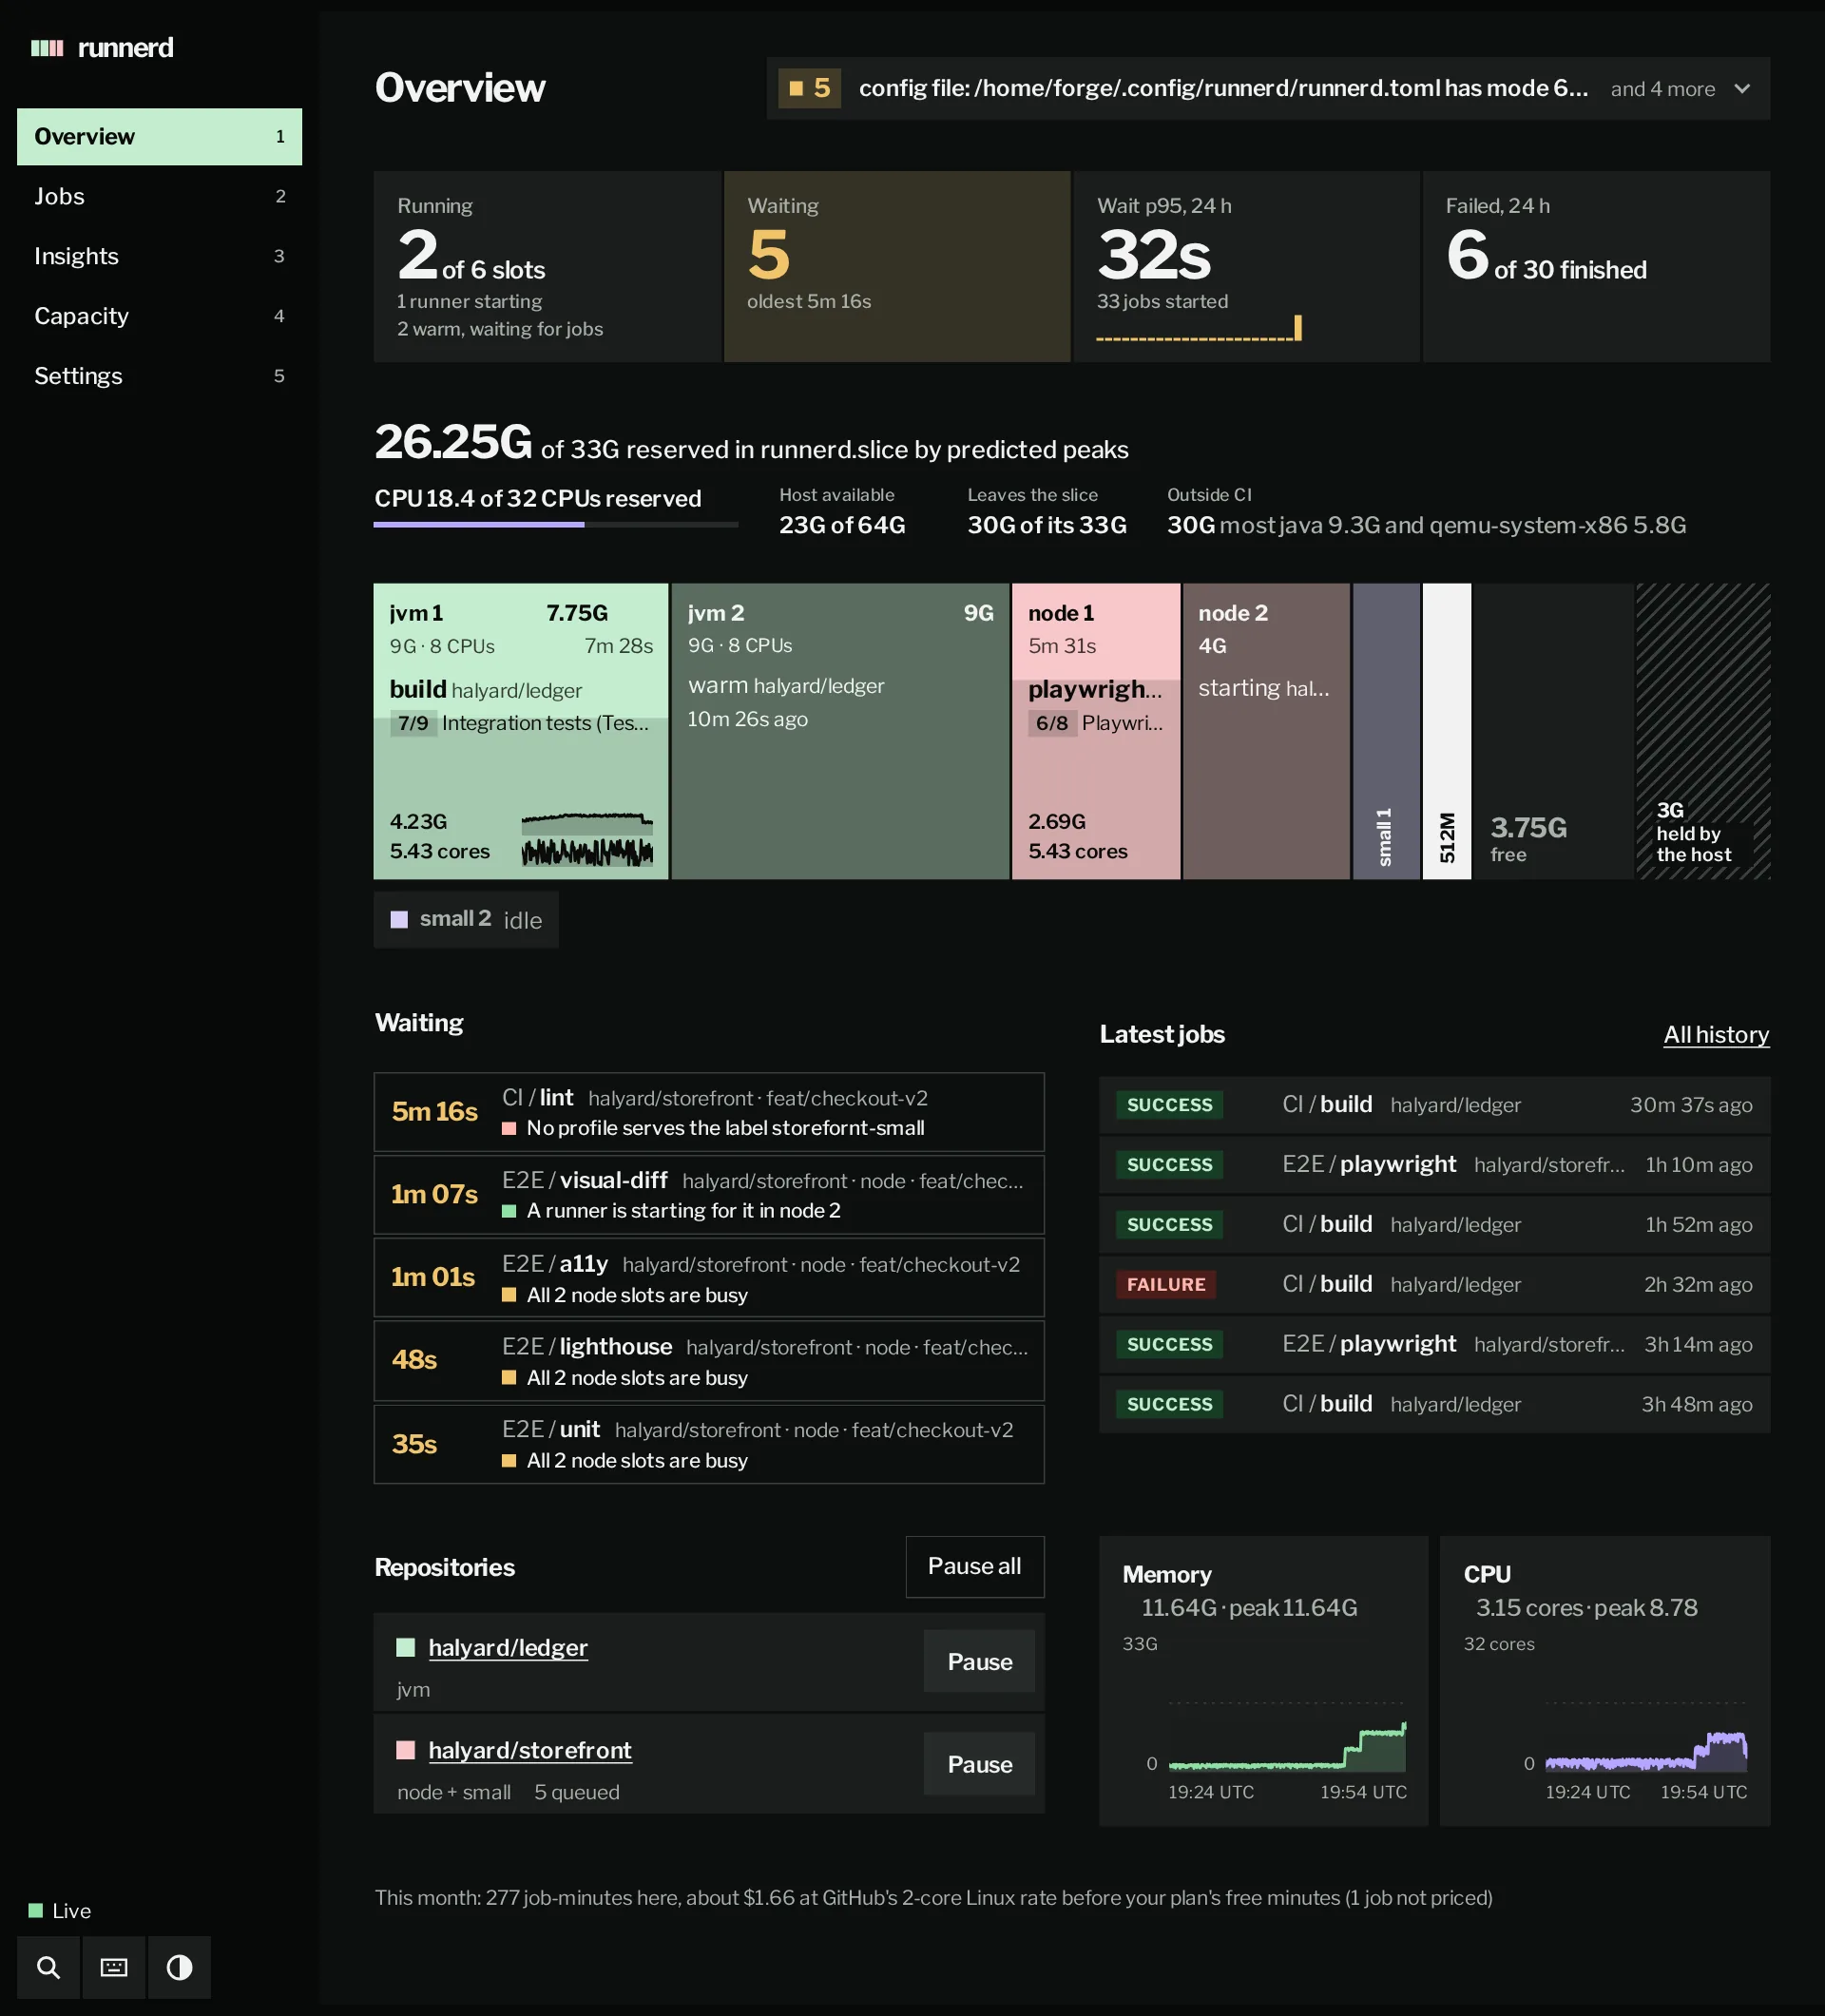
The overview opens on four figures and the memory budget: a lane per slot, as wide as its share of the slice and filled to what its job uses now. What needs attention is one line beside the title that opens to the list.
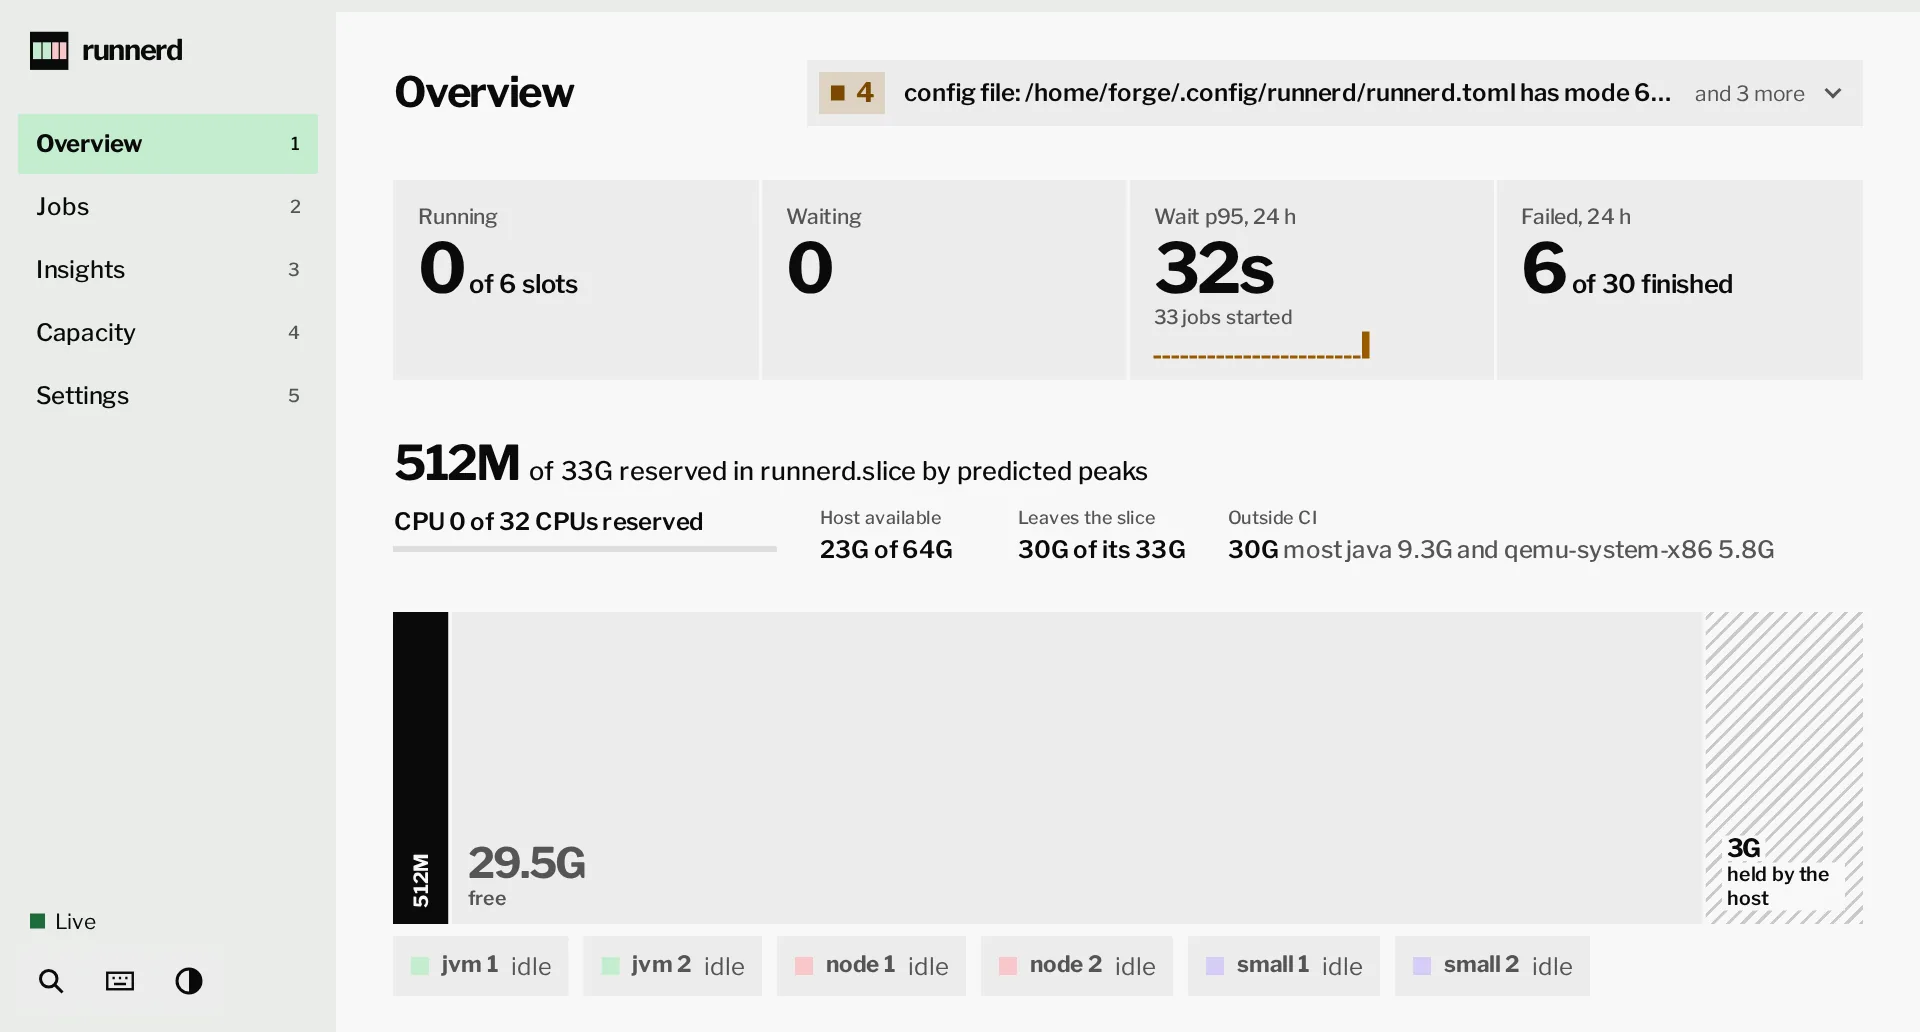
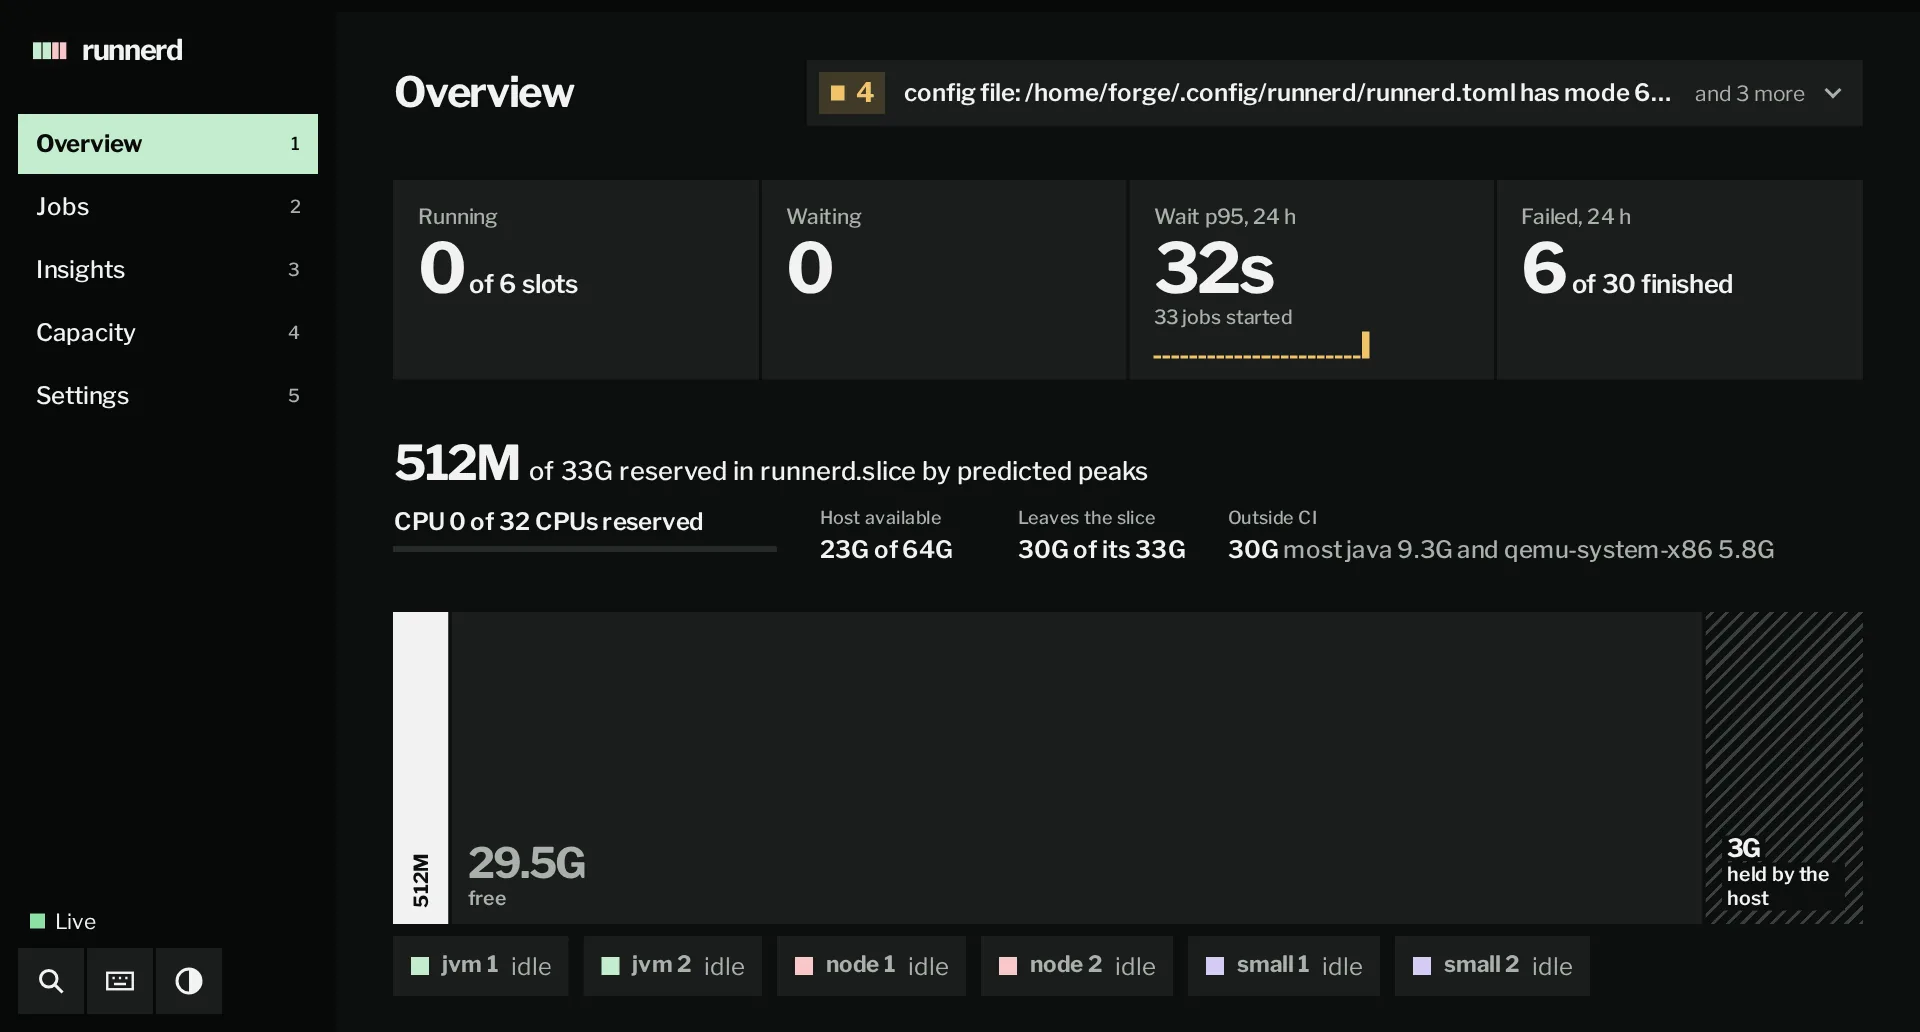
With no runner up, under measured admission, no slot holds any of the budget: the lanes are the mirror, what is free and what the host holds, and each slot is a chip under them, or a row on a phone.
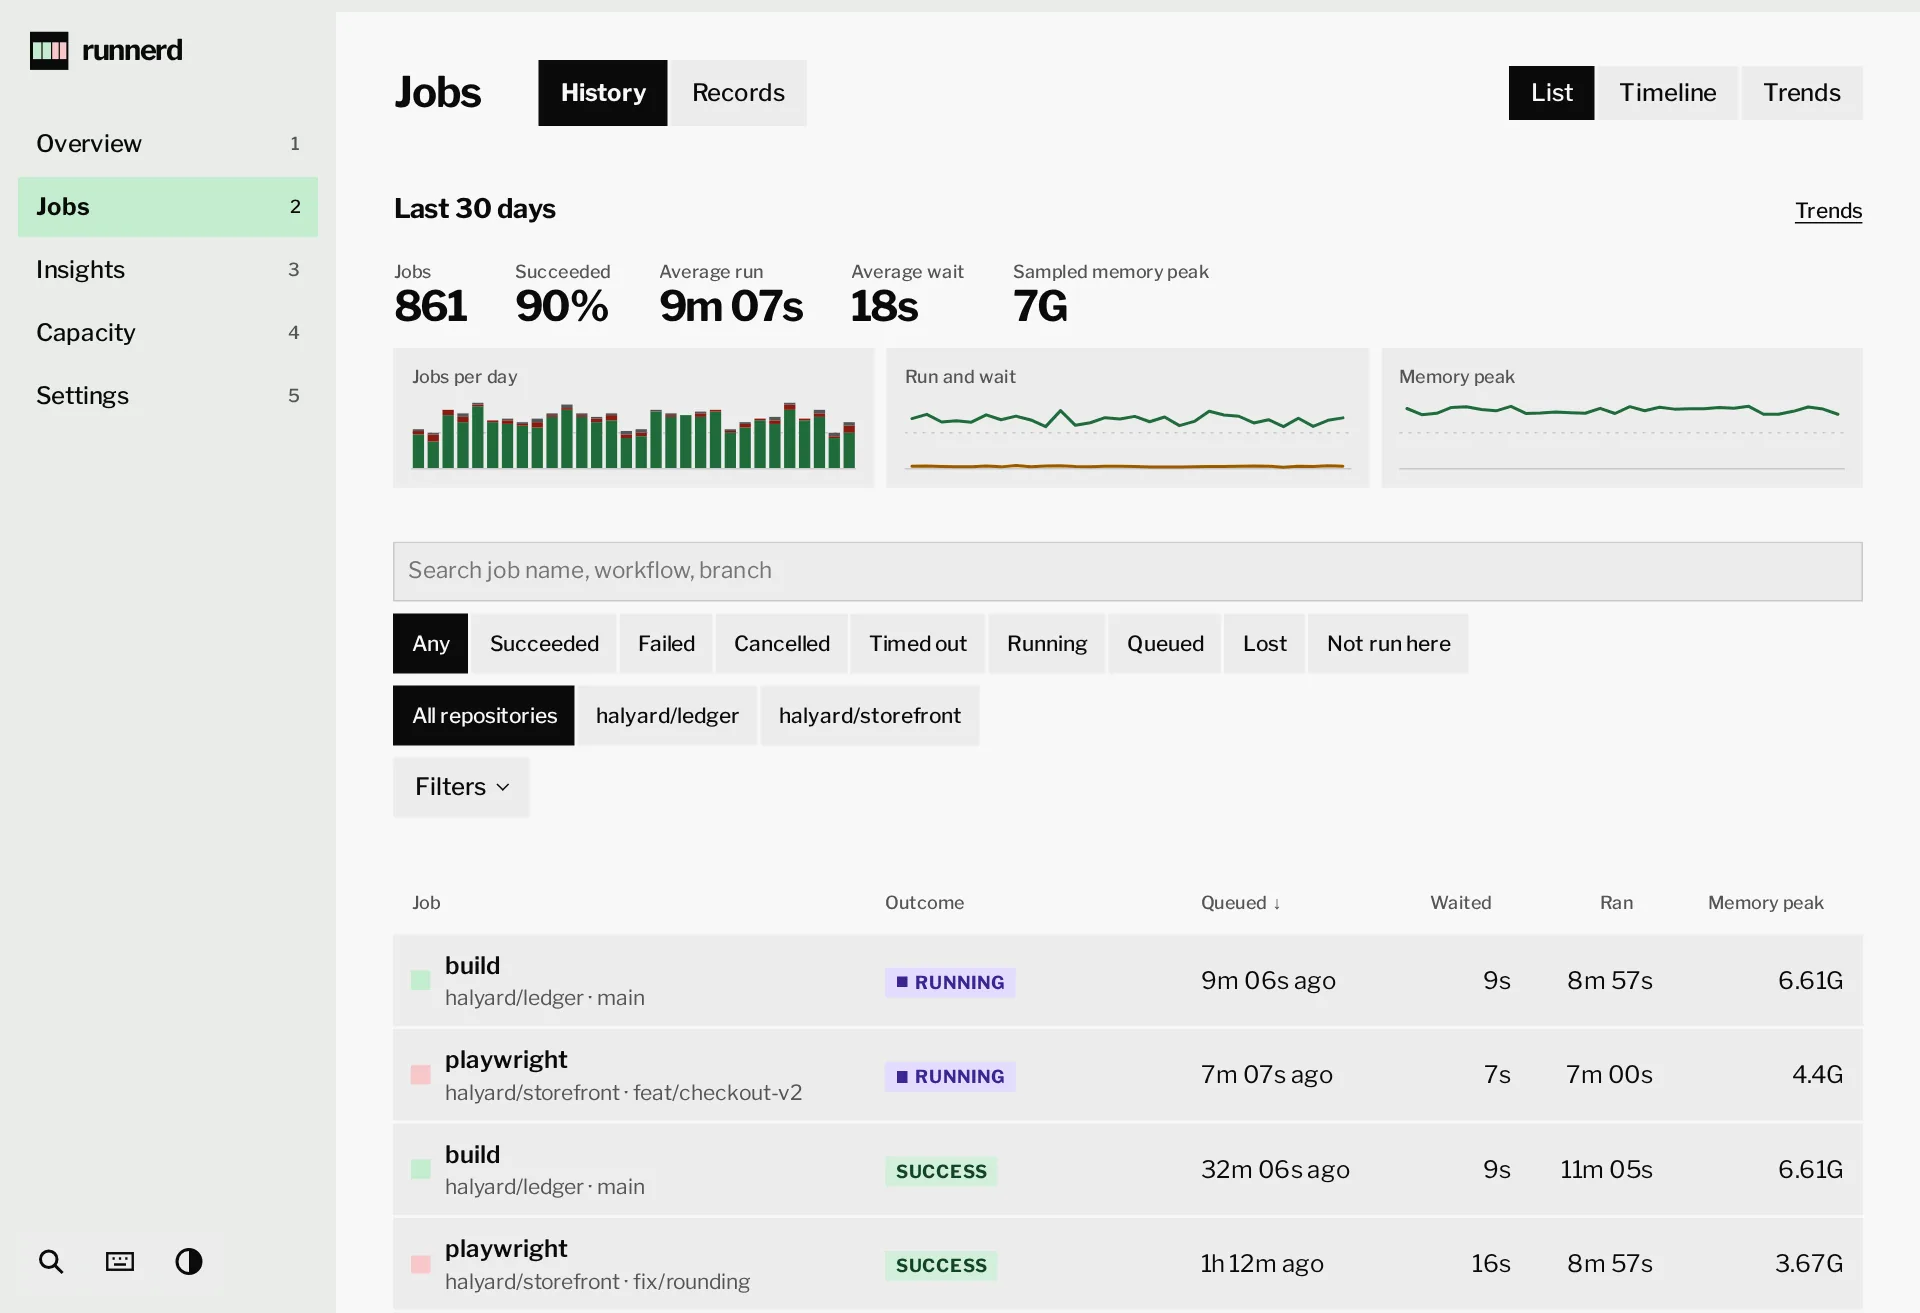
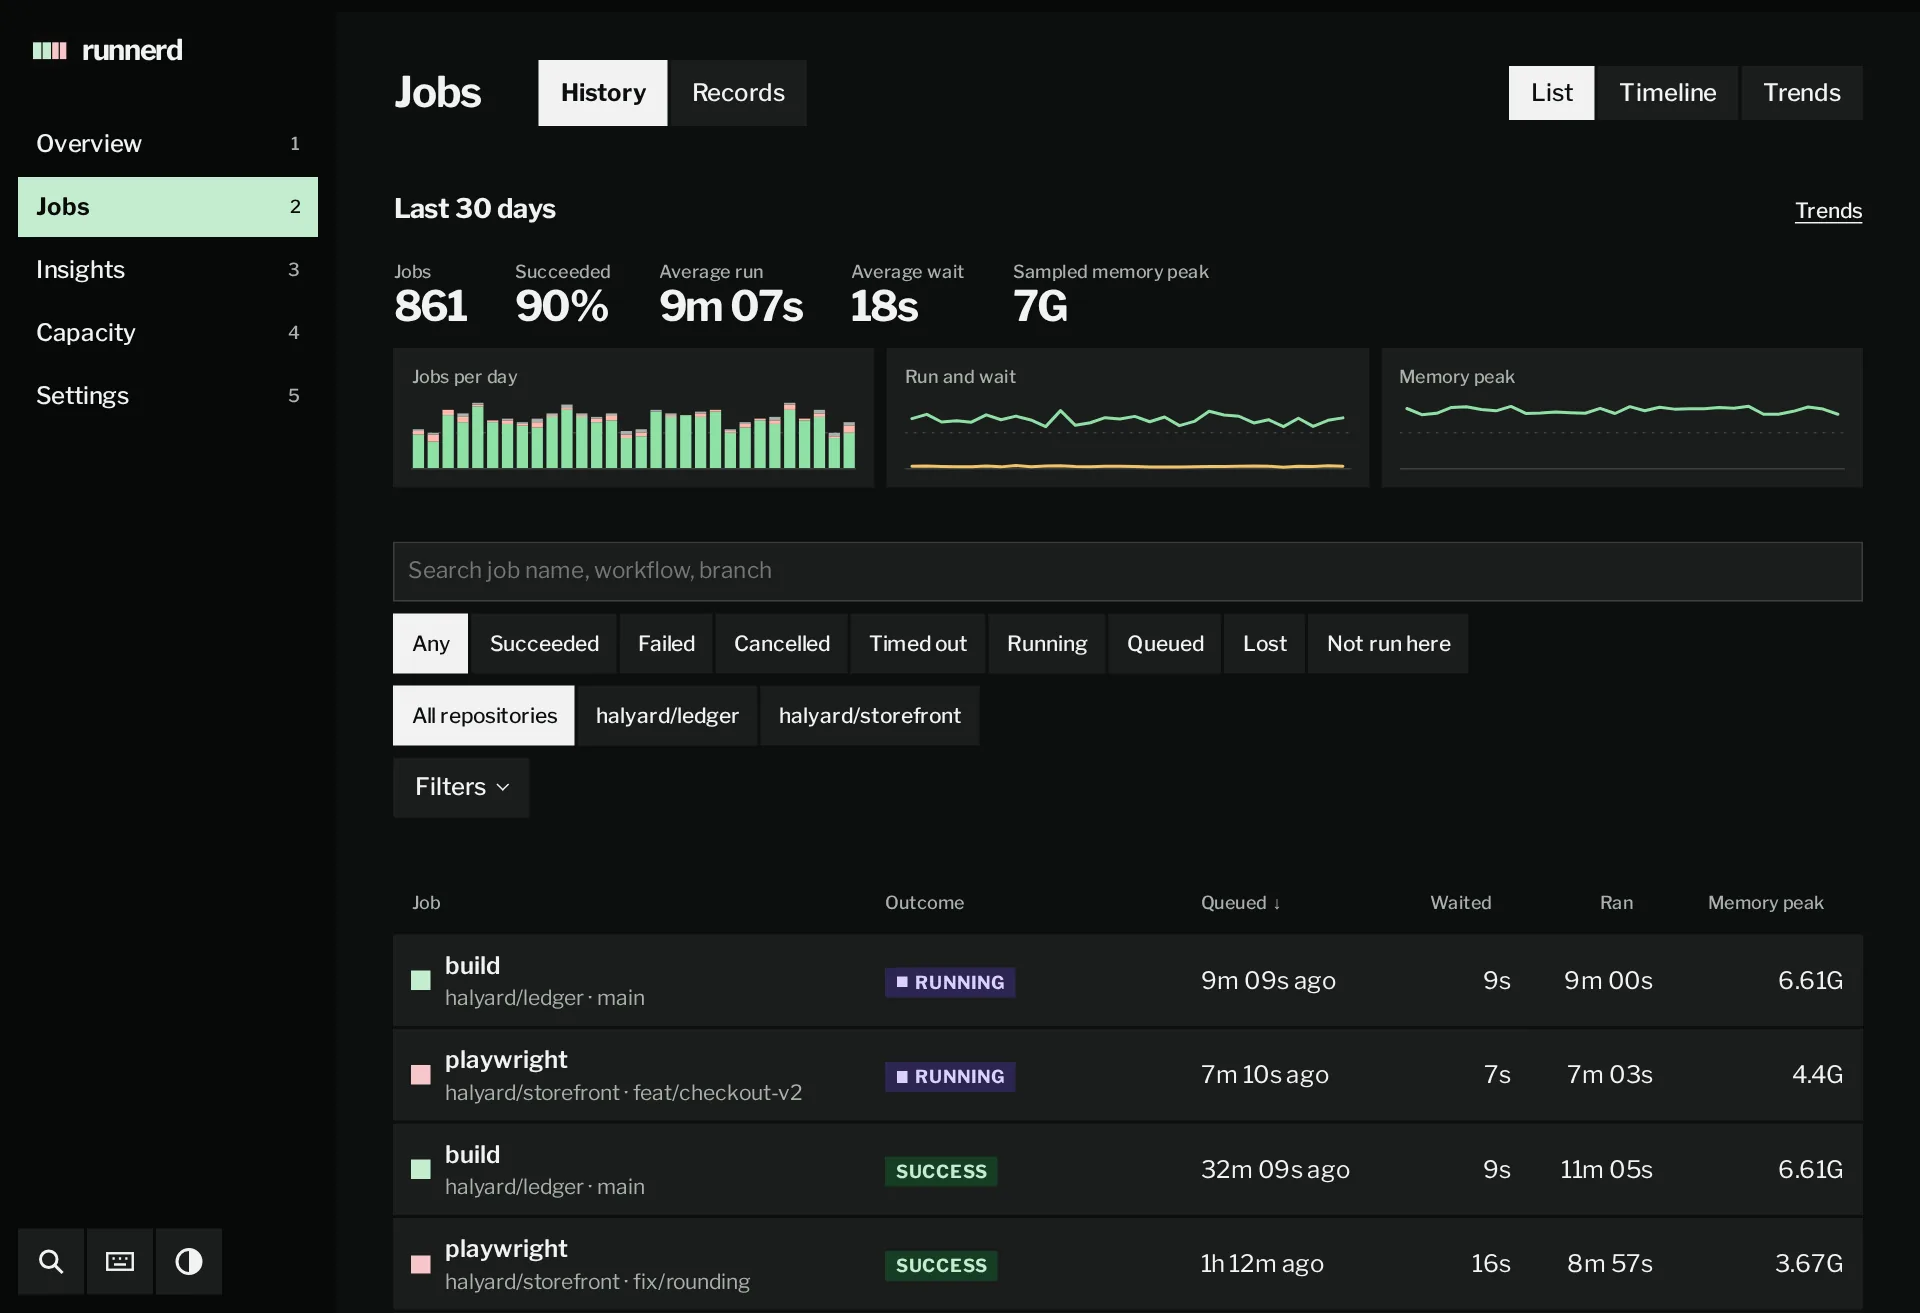
Jobs opens on its last 30 days, then one search field and the rows. Five views, 1 to 5 on the keyboard: Overview, Jobs, Insights, Capacity and Settings. Pages and keys lists what each shows.
The terminal dashboard
Section titled “The terminal dashboard”runnerctl tui is for a host you reach over SSH. Its views and keys follow the dashboard’s.
 runnerd 0.1.5   1 Overview  2 Jobs  3 Insights  4 Capacity  5 Settings             ▲ 5  ■ live
Running                 Waiting                 Wait p95, 24 h          Failed, 24 h
2 of 6 slots            5, oldest 4m 53s        32s ▁▁▁▁▁▁▁▁▁▁▁▁▁▁▁▁▁▁█ 6 of 30 finished
▲ 5  config file: /home/forge/.config/runnerd/runnerd.toml has mode 644, so…  and 4 more  ! open
Budget                  26.25G of 33G reserved in runnerd.slice by predicted peaks · mirror 512M
███████████▓▓▓▓▓▓▓▓▓▓ ▓▓▓▓▓▓▓▓▓▓▓▓▓▓▓▓▓▓▓▓▓▓▓▓▓ ██████▓▓▓▓ ▓▓▓▓▓▓▓▓▓▓ ▓ ▒ ··········╱╱╱╱╱╱╱╱╱╱╱╱
jvm 1                 jvm 2                     node 1     node 2         free      host
4.2G of 7.8G reserved warm 9G reserved          2.67G      starting 4G    3.75G     3G
■ jvm 1   CI / build                    7/9 Integration tests (Testcontainers) 7m 05s 4.19G 5.31
■ jvm 2   a warm runner for halyard/ledger, waiting for a job · started 10m 03s ago
■ node 1  E2E / playwright              6/8 Playwright e2e                     5m 08s 2.67G 5.31
■ node 2  a runner for halyard/storefront waiting for its job · started 15s ago
■ small 1 a warm runner for halyard/storefront, waiting for a job · started 4m 23s ago
■ small 2 idle
Waiting                                                                             oldest first
4m 53s CI / lint         No profile serves the label storefornt-small
   44s E2E / visual-diff A runner is starting for it in node 2
   38s E2E / a11y        All 2 node slots are busy
   25s E2E / lighthouse  All 2 node slots are busy
   12s E2E / unit        All 2 node slots are busy
 Repositories ──────────────────────────────────────────────────────────────────── 1 more below
■ halyard/ledger  jvm  0 queued
 Latest jobs ──────────────────────────────────────────────────────────────────── 18 more below
SUCCESS CI / build       halyard/ledger                                      11m 05s 30m 14s ago
SUCCESS E2E / playwright halyard/storefront                                   8m 57s  1h 10m ago
 ! attention  tab pane  j/k move  enter open  p/r pause/resume  R reseed  ? help  q quit
Scroll to inspect →
When the daemon goes away the header says reconnecting and the event stream resumes where it stopped. cargo build -p runnerd-cli --no-default-features builds runnerctl without the TUI.
runnerctl
Section titled “runnerctl”Every command prints text, or with --json the API’s response unchanged; --socket picks another socket. runnerctl lists them all.
$ runnerctl job 120055991526Usage Memory peak 6.61G Average memory 5.13G CPU peak 7.57 cores Average CPU 3.33 cores CPU time 37m 43s Received 506.45M Sent 56.27M Written to disk 1.84G in 31207 writes; 64M more waited to be written back as its container ended From the mirror 168.82M CPU held back held at its CPU cap in 5% of its busy time, waited for a CPU 25% of its run Build cache 30 of 36 lookups hit (83%), 101.29M served, 12.66M stored Log 54 lines, 2.15K runnerctl logs 120055991526 memory peaks are sampled every 2 s; spikes shorter than that do not showThe job tables have the columns Outcome, Job, Repository, Branch, Queued, Waited, Ran, Memory peak, CPU and Written. Written is what the job’s runner container sent the disk under Docker’s root, its own containers’ writes included, from the job’s start to the container’s end; ≥ marks a floor, when part of the run was not read, such as an end while runnerd was stopped. CPU held back gives a share of the job’s busy time, which reads higher than the share of the whole run that auto sizing counts.
Frames set in JetBrains Mono (OFL).