
Why did this job fail?
Open the job: from the overview’s latest jobs, the Jobs page (?outcome=failure lists the failed ones), the link in a notification, or runnerctl jobs --failed. A failed job’s page opens on what failed: the step, its exit code, its last lines and, while its record is kept, the runnerctl shell command.
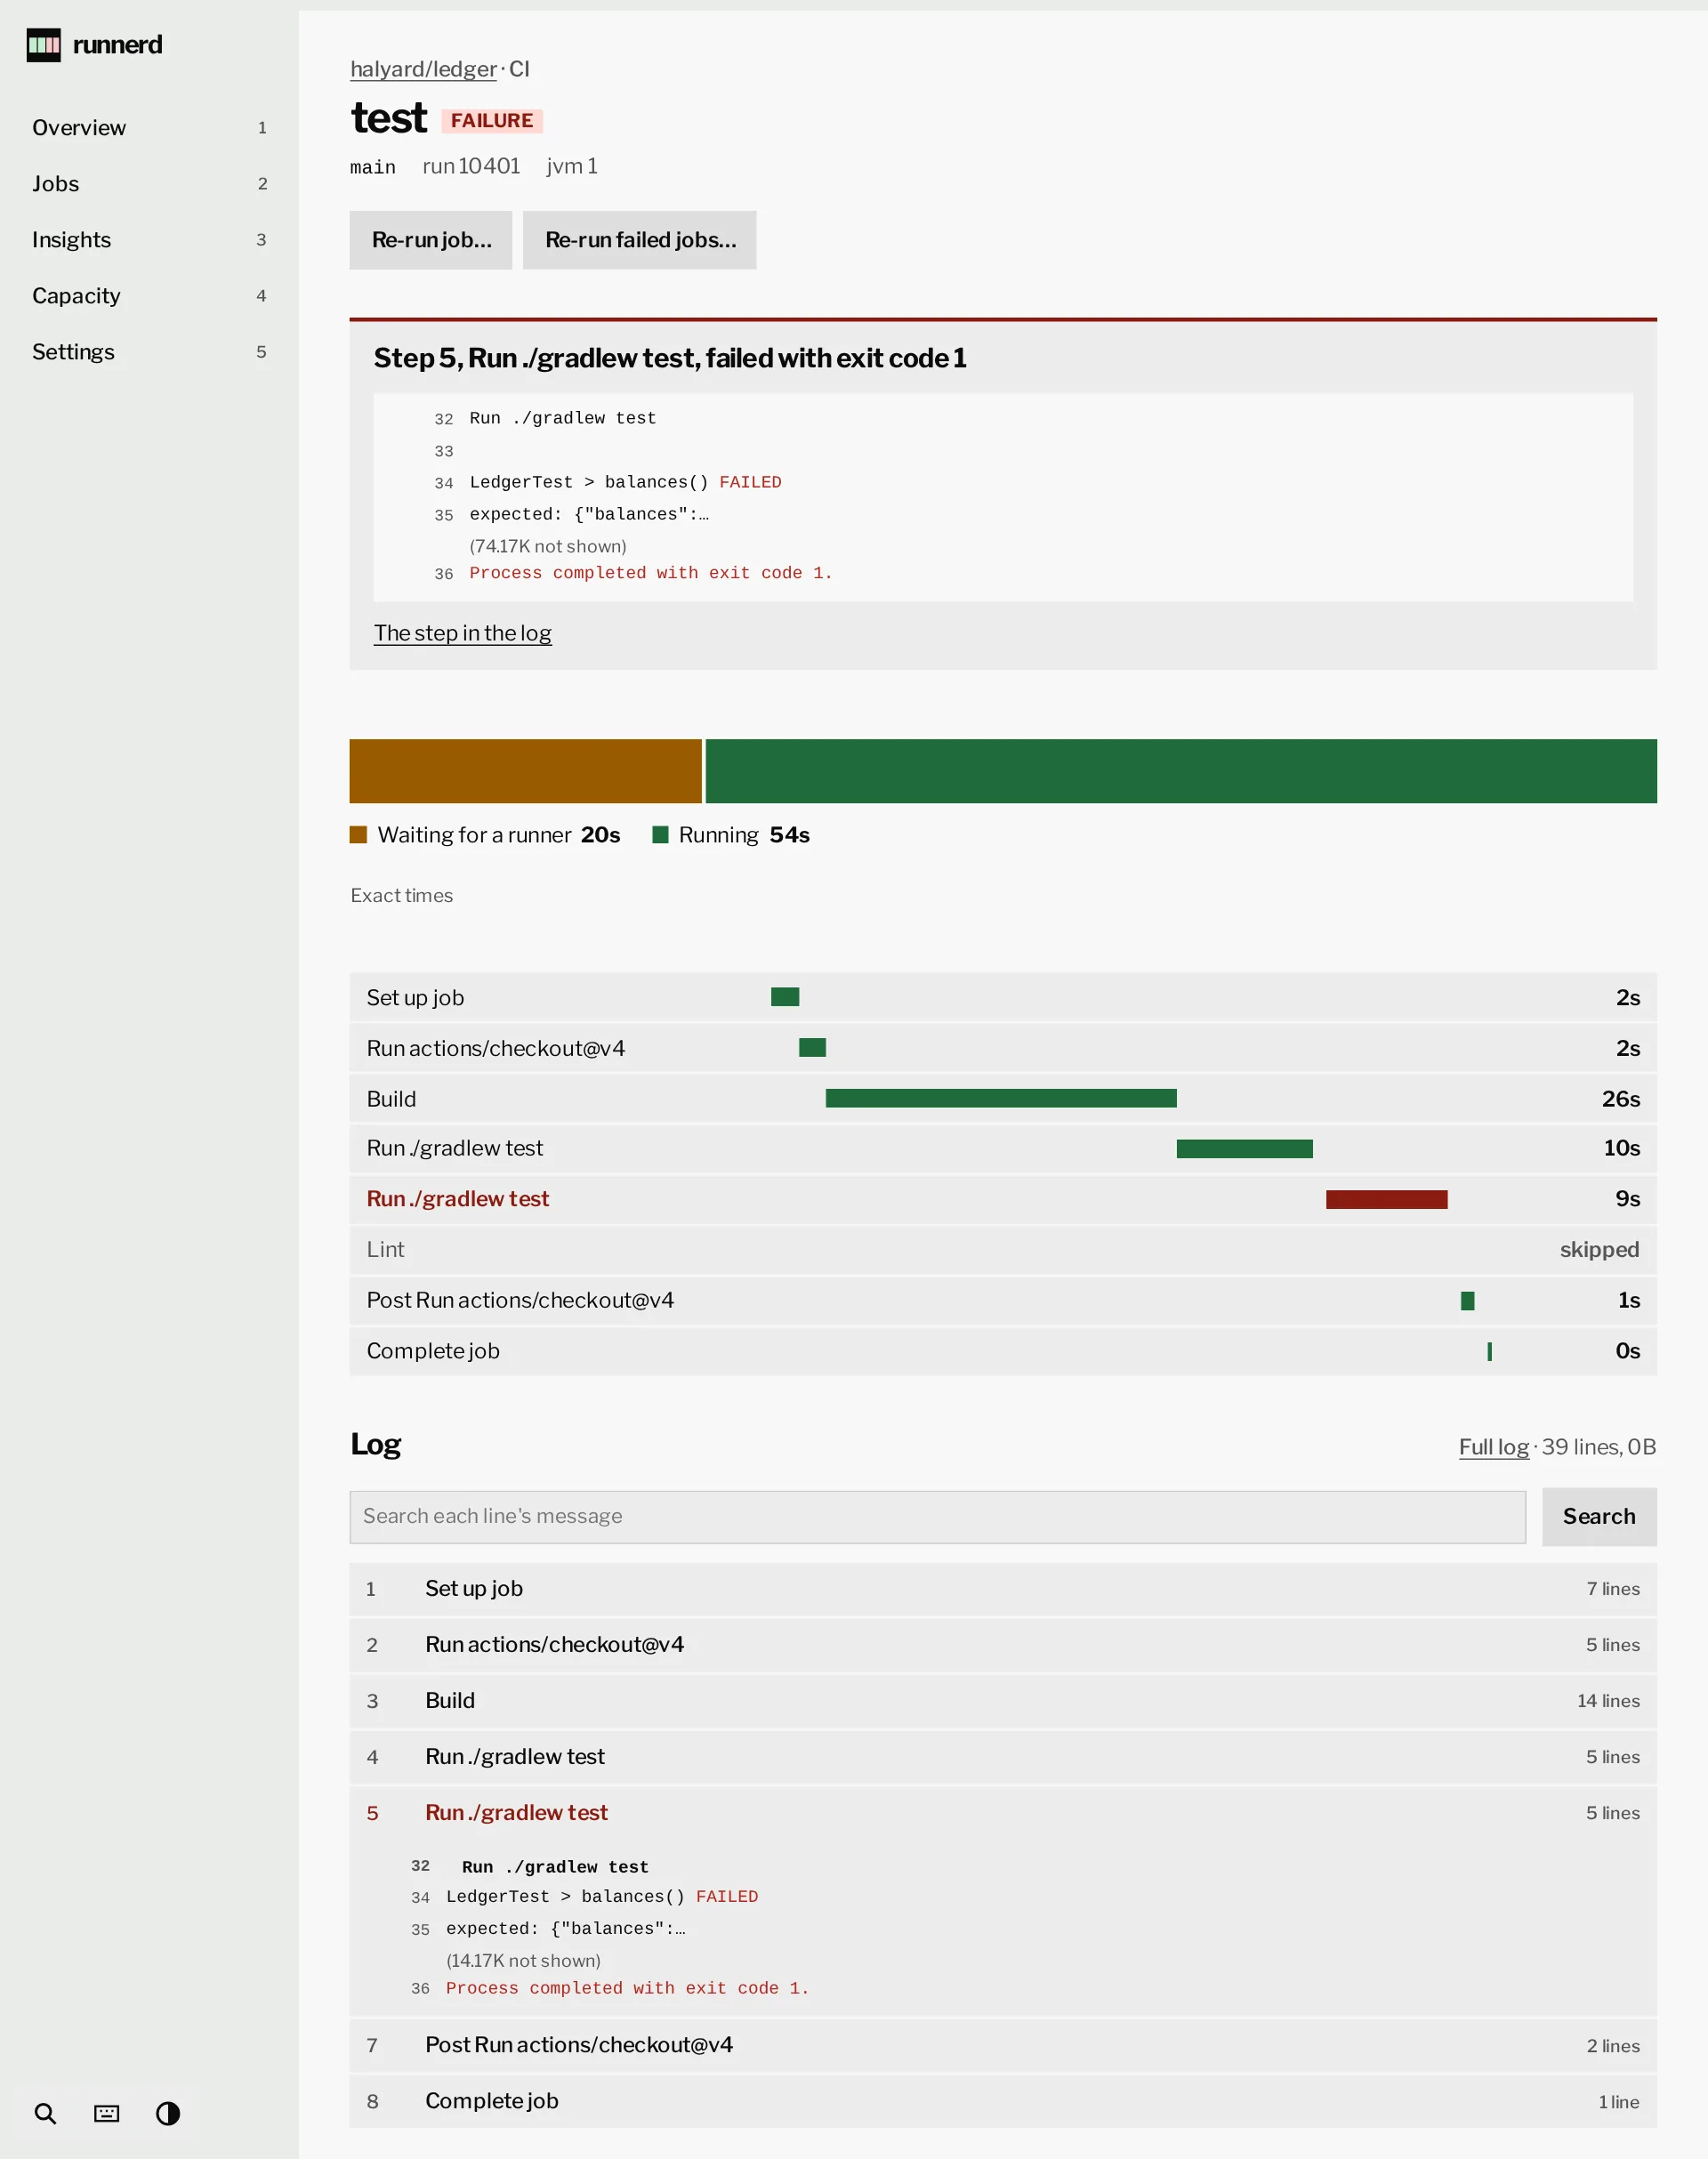
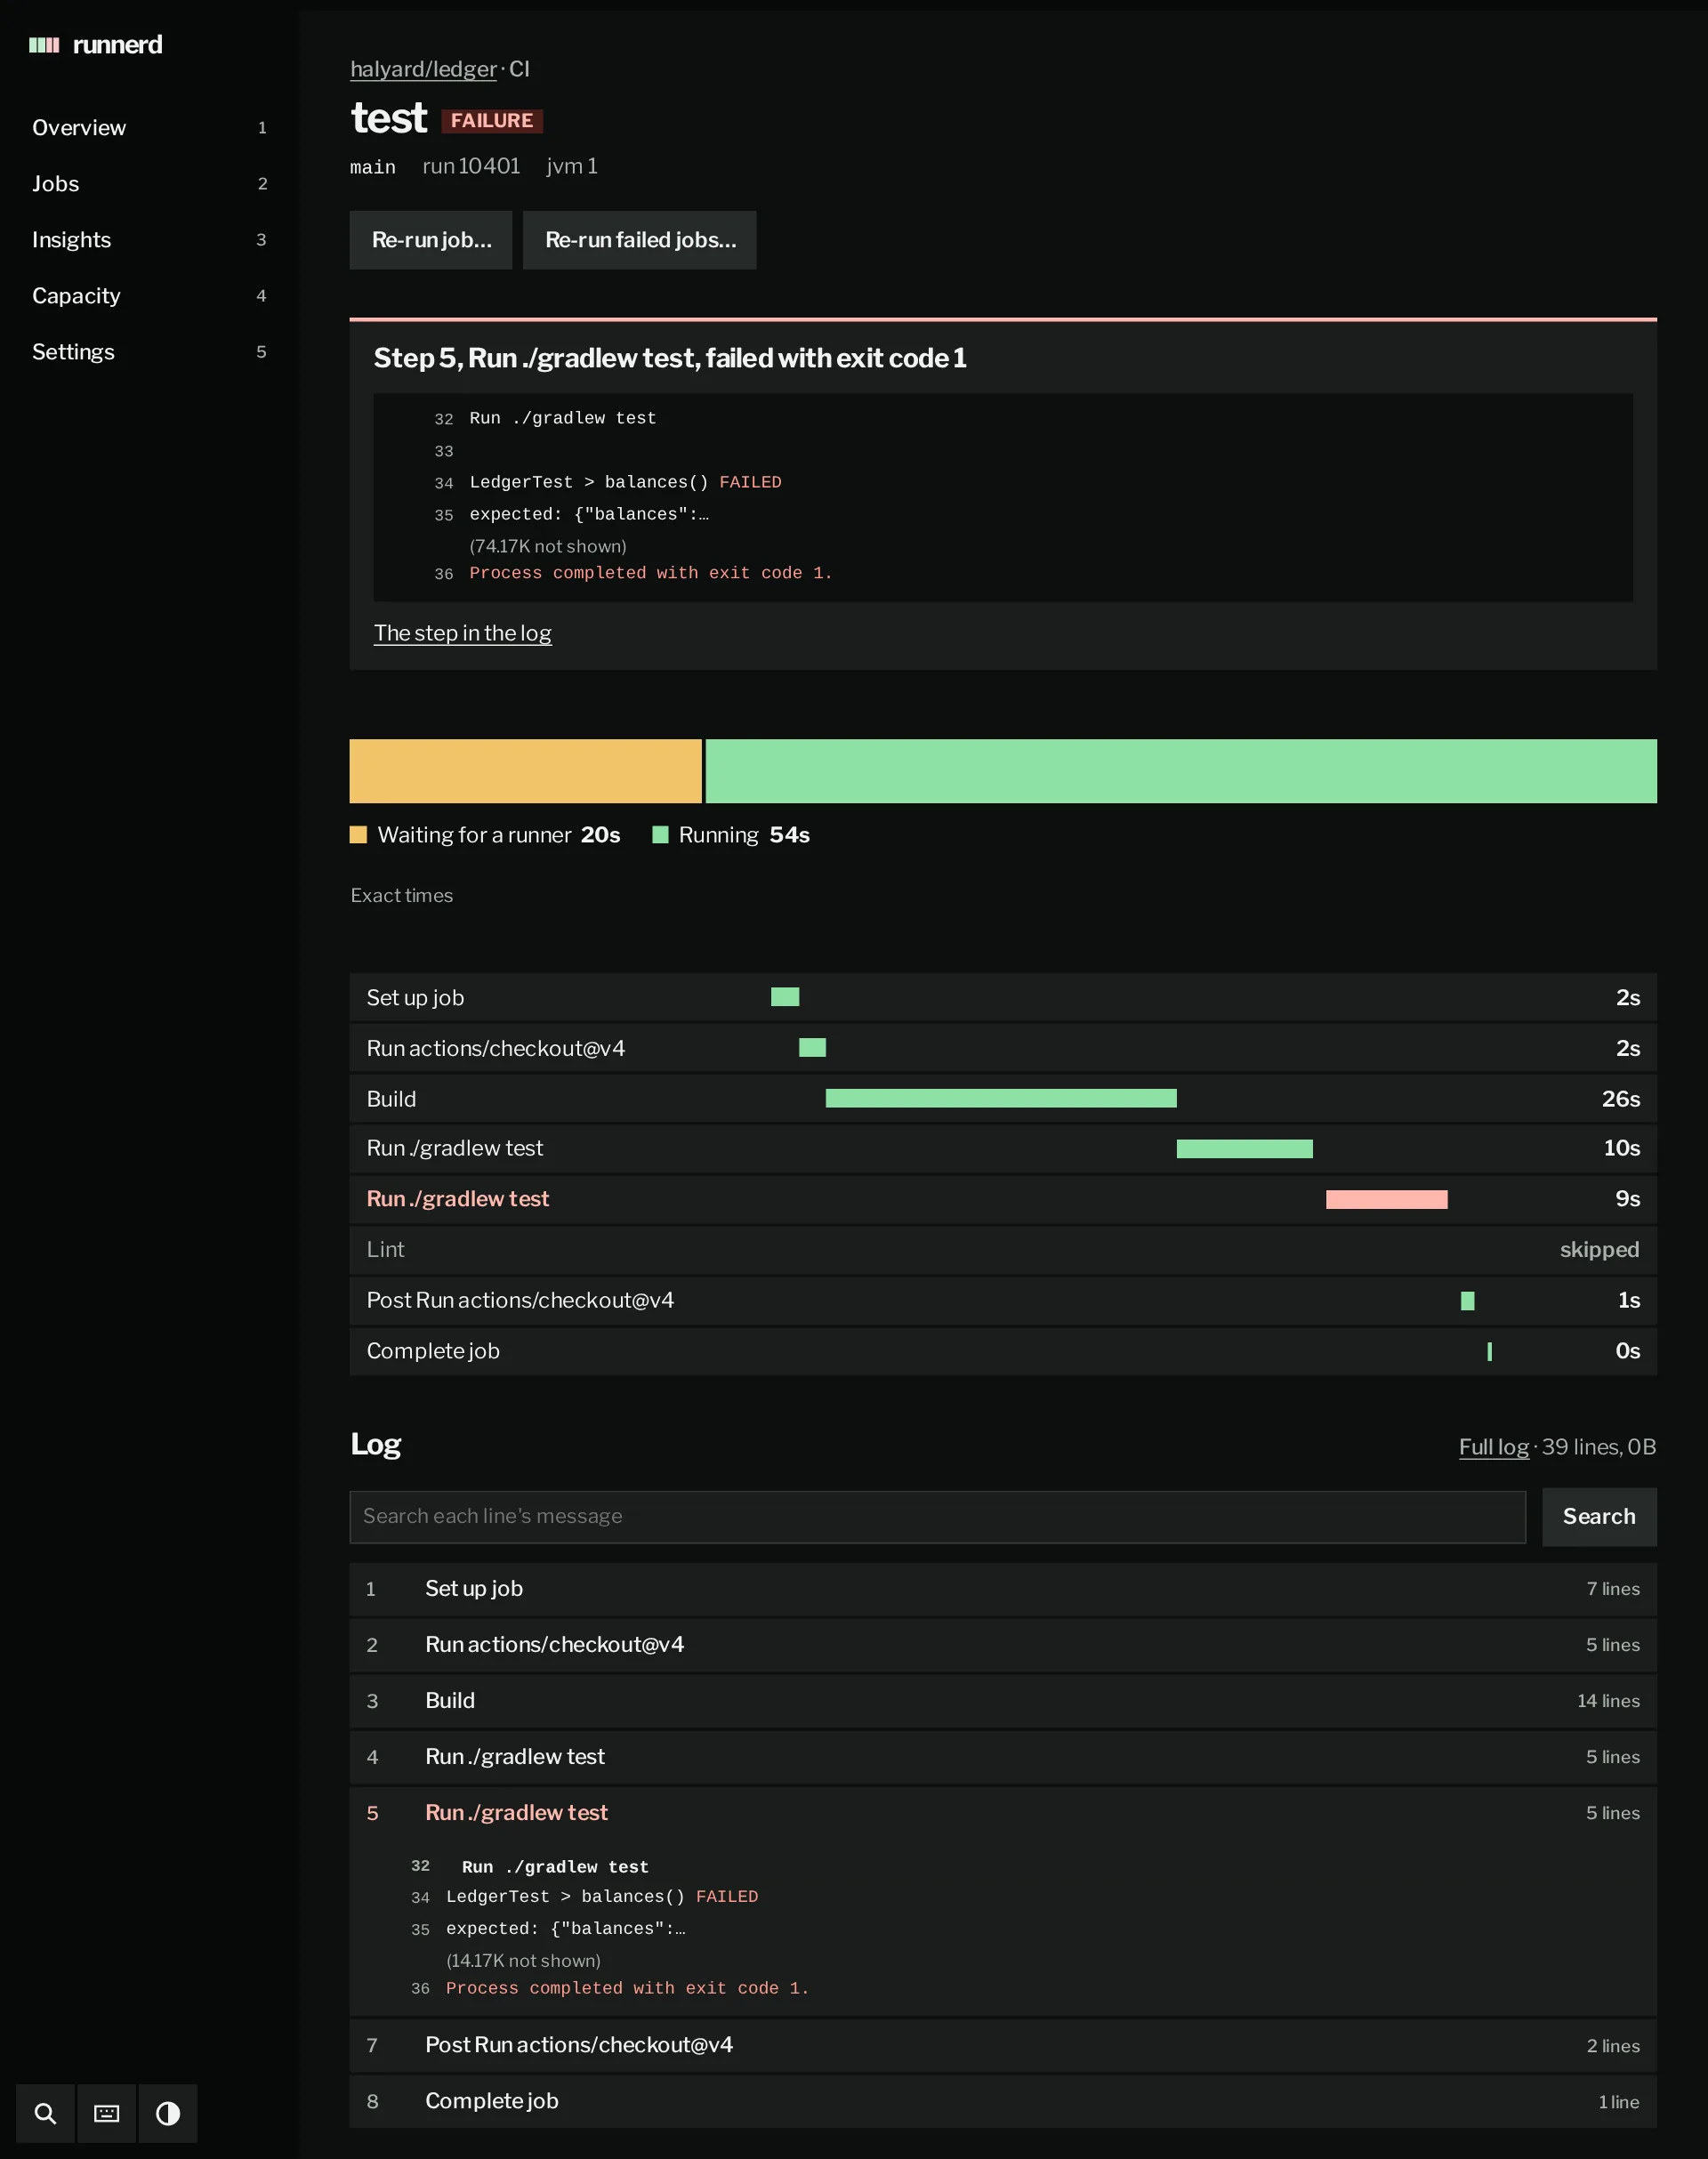
The log
Section titled “The log”The log is folded by step, the failed step open and scrolled to; nested groups fold too. Each line has a link (#L120), so a line can be sent to someone. The search finds text in the lines’ messages, not their timestamps or ##[…] commands. Colours come through as the job printed them. While the job runs, Follow keeps the newest lines in view.
From a terminal, the TUI’s job view shows the same: enter folds or opens a step, / searches, n and N go to the next and previous match. runnerctl logs <id> prints the plain log; -f follows it to the end.
 runnerd 0.1.5   1 Overview  2 Jobs  3 Insights  4 Capacity  5 Settings  job 120055991489                   ▲ 5  ■ live
■ halyard/ledger
CI / build  FAILURE
branch main · slot jvm · 2 · waited 11s · ran 11m 05s · record kept: runnerctl shell 120055991489
Step 6, Unit tests, failed
shell into its record: runnerctl shell 120055991489
░▒██████████████████████████████████████████████████████████████████████████████████████████████████████████████████████
░ Waiting for a runner 5s  ▒ Runner starting 6s  █ Running 11m 05s
Steps                                                                                                 11m 05s in 9 steps
Set up job                         █                                                                                 3s
Run actions/checkout@v6            █                                                                                 4s
Set up JDK 21                      █                                                                                 6s
Restore Gradle cache                █                                                                                9s
Build                                ████████████████                                                            2m 28s
Unit tests                                           ███████████████████████                                     3m 32s
Integration tests (Testcontainers)                                           ███████████████████████████████     4m 41s
Post Run actions/checkout@v6                                                                                █        1s
Complete job                                                                                                █        1s
mem  6.07G ▅▅▅▅▅▅▅▆▅▆▅▅▅▆▅▅▅▅▅▅▅▅▆▅▅▅▅▅▅▅▆▅▅▆▅▅▆▅▅▆▆▅▅▅ cpu  6.62 ▄▆▂▆▃▃▁▇▁▁▇▄▄▅▁▁▇▆▃▃▁▄▅▇▃▆▆▅▆▇▅▆▃▅▅▅▂▄▆▃▁▅▅▆
Memory peak 6.61G  Average memory 5.13G  CPU peak 7.59 cores  Average CPU 3.63 cores  CPU time 40m 39s  Received 497.53M
held at its CPU cap in 9% of its busy time, waited for a CPU 37% of its run
Latest 17 runs                                       median run 11m 05s · wait 20s · 2 of 16 failed · largest peak 6.61G
ran ████████████████▅  waited ▂▆▂▄▅▆▇▆▃▅█▆▅▃▆▂▂  peak ▇▇█▇▇▇▇▇▇▇▇▇▇▇▇▇▇
 Log ──────────────────────────────────────────────────────────────────────────────────────────────── 9 rows up, G ends
▾ lines 1–54
   ▸ Set up job
   ▸ Run actions/checkout@v6
   ▸ Set up JDK 21
   ▸ Restore Gradle cache
   ▸ Build
   ▸ Unit tests
   ▸ Integration tests (Testcontainers)
   ▸ Post Run actions/checkout@v6
   ▸ Complete job

 enter fold  / search  n/N match  c compare  x cancel  a/A re-run  G follow  esc back  1-5 views  ? help  q quit
Scroll to inspect →
Compared with an earlier run
Section titled “Compared with an earlier run”The job’s page sets it beside the latest earlier success of the same job on its branch: whole-job figures and each step’s time, paired by name. In the TUI, c does the same.
Everything else on its page
Section titled “Everything else on its page”The page also shows its wait, split at when runnerd first saw the job queued (Seen by runnerd, missing for a job a waiting runner took before runnerd listed it) and when its runner started, its steps on one time axis, memory and CPU against the container’s caps (with what admission reserved when that was less), how often the CPU cap held it back, and its latest 30 runs. Cancel and re-run sit at its top.
A job that failed reads runner fault, not failure, when its failed step’s log shows Sysbox losing the runner’s seccomp listener: function not implemented on a mount, umount or openat2, or unsafe procfs detected … invalid argument. Its code did not fail, and a re-run on a new runner is the answer, which runnerd can ask GitHub for itself. It still counts as a failure in the stats and notifications.
The Sysbox probe is off by default. To collect verdicts on one profile, set sysbox_probe_profile under [host] to that profile’s name. After a normal runner exit, its image tries a few mounts and an openat2 under /proc. A failed job’s page shows the verdict under its outcome, as does any job whose probe found a call failing. A failed job without a stored verdict reads no probe verdict recorded. For a successful canary job, check runnerctl job <id> --json for probe: "clean". This means the sampled calls succeeded, not that every call worked during the job. The verdict does not change outcomes or trigger reruns.
Frames set in JetBrains Mono (OFL).