
Trends
trends shows daily movement over time instead of a tabular aggregate.
llm-usage trends [options]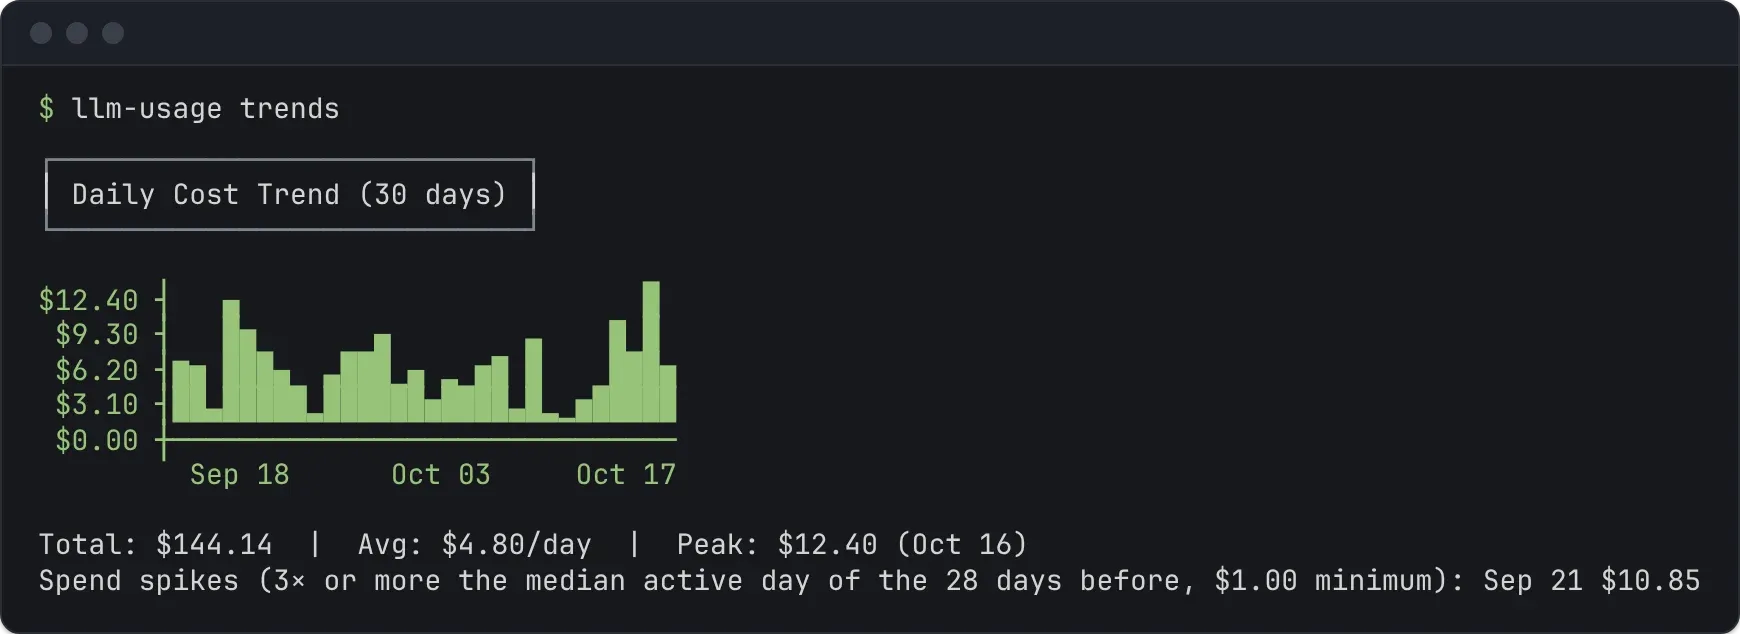
Examples
Section titled “Examples”# Default: last 30 local calendar days of costllm-usage trends
# Last 7 days of token usagellm-usage trends --metric tokens --last 7
# Combined date windowllm-usage trends --since 2026-02-01 --until 2026-02-28
# Per-source JSON outputllm-usage trends --by-source --json
# One row per projectllm-usage trends --by-repo --metric active-hours
# Write an interactive HTML report of the last 14 daysllm-usage trends --last 14 --shareOptions
Section titled “Options”--last <n>: chart the last n local calendar days, counting today--all: chart every day from the first day with usage through today; not with--last,--sinceor--until--metric <name>:cost(default),tokens, oractive-hours--by-source: render one sparkline row per source--by-repo: render one sparkline row per project; cannot be combined with--by-source--share: write an interactive reporttrends-share.htmlof the date range- shared filters apply:
--source,--provider,--model,--repo,--machine,--since,--until,--timezone, source-path overrides, pricing flags, and--no-history
trends supports terminal output, --json, --markdown (one row per date plus a Total row), and --share. In the share report you can split the charts by source, model, project, or machine, whatever the command’s flags.
--last vs --since / --until
Section titled “--last vs --since / --until”- If you pass
--last <n>, the range istoday - (n - 1)through local today. - If you pass neither
--lastnor explicit date flags, the command defaults to the last 30 local calendar days. --lastcannot be combined with--since,--untilor--all, and--allcannot be combined with dates.--untilwithout--sinceexpands back to the earliest observed day after filtering.
Metric semantics
Section titled “Metric semantics”--metric cost
Section titled “--metric cost”- Reuses the same pricing pipeline as usage reports.
- Incomplete pricing is carried into the trend output.
- Approximate totals and peaks use the existing
~convention. - Marks spend spikes: days that cost at least $1 and at least 3 times the median cost of the active days among the 28 days before them. A day with fewer than 3 active days before it is never a spike. The terminal and Markdown output list them under the totals; JSON sets
spike: trueon those days intotalSeries. To check the first days of the chart,trendsalso reads the 28 days before it.
--metric tokens
Section titled “--metric tokens”- Uses daily
totalTokens. - Skips pricing loads entirely.
- Pricing flags are accepted but have no effect in this mode.
--metric active-hours
Section titled “--metric active-hours”- Charts per-day active time: each day’s events are grouped by session, gaps between consecutive events are capped at 5 minutes, and time where sessions overlap counts once, so a day never exceeds 24h. The total is wall-clock time, matching
wrapped’sHours; with--by-sourceor--by-repo, each series takes the union of its own sessions, so when sources or projects ran in parallel the series can add up to more than the total. - A session crossing midnight splits at the day boundary: each day counts only the gaps between that day’s events.
- Terminal and Markdown output format durations (
2h 14m); JSONvalue,total,average, andpeak.valueare milliseconds, matching sessionactiveMs. - Skips pricing loads entirely, like
tokens.
--by-source
Section titled “--by-source”--by-source renders one sparkline row per source instead of a single combined chart.
- source order follows the adapter/source order
- missing days are zero-filled
- sources with no observed data in the selected range are omitted
--by-repo
Section titled “--by-repo”--by-repo renders one sparkline row per project, ordered by total, with the same zero-filled days as --by-source. JSON carries the rows under projectSeries, each with repoRoot (null for (unattributed)), project, buckets, and summary.
With --metric active-hours, a session that moves between projects splits into runs at each switch. Each run counts its own capped gaps for its project; the gap across a switch counts for neither, and a return to a project starts a new run. The projects therefore never add up to more than the combined active time.
Reading approximate cost output
Section titled “Reading approximate cost output”When any bucket in the selected range has incomplete pricing:
- the affected series summary is marked approximate with
~ - JSON includes
incomplete: trueon affected buckets and summaries
If no observed bucket in the selected range has resolved cost, the terminal output adds a note suggesting --metric tokens or working pricing.
JSON shape
Section titled “JSON shape”{ "schemaVersion": 1, "report": "trends", "data": { "metric": "cost", "dateRange": { "from": "2026-02-06", "to": "2026-03-06" }, "totalSeries": { "source": "combined", "buckets": [ { "date": "2026-02-06", "value": 1.57, "observed": true }, { "date": "2026-02-07", "value": 0, "observed": false } ], "summary": { "total": 87.4, "average": 2.91, "peak": { "date": "2026-02-28", "value": 5.12 }, "incomplete": true, "observedDayCount": 12 } } }}Diagnostics are never included in the JSON body; they remain on stderr.